

by Flint Adam, Nolensville resident & Realtor®
Friday, July 7, 2017
It was late March when I first noticed something was going on.
I had a listing in Bent Creek – a renovated, turn-key, all-brick home with new carpet, new granite counters in the kitchen, fresh paint throughout, and fresh landscaping. List price was $379,900.
This was going to be a slam dunk. Except it was not.
We had around 20 showings the first weekend. No offers. I was stunned. I spoke with several buyers and some said it was just above what they could afford… others said it was in great condition but lacked some of the frills they were seeking. Several remarked on how expensive Nolensville was.
The house sat on the market for weeks and perplexed me like few other listings have. I kept on meeting buyers who kept on saying similar things – mainly that Nolensville was too expensive and they were going to have to look elsewhere… like Spring Hill or Mount Juliet.
I looked around the marketplace and remember finding four or five other homes – several in Winterset Woods – that were almost a duplicate of what I had listed. Newly renovated, similar price, size and features, turn-key and ready for quick move in. All of them sitting.
Then April happened. You may have read my blog at the time. There was a 21% drop in year-over-year sales in Williamson County Nolensville. This was odd, but not quite unprecedented.
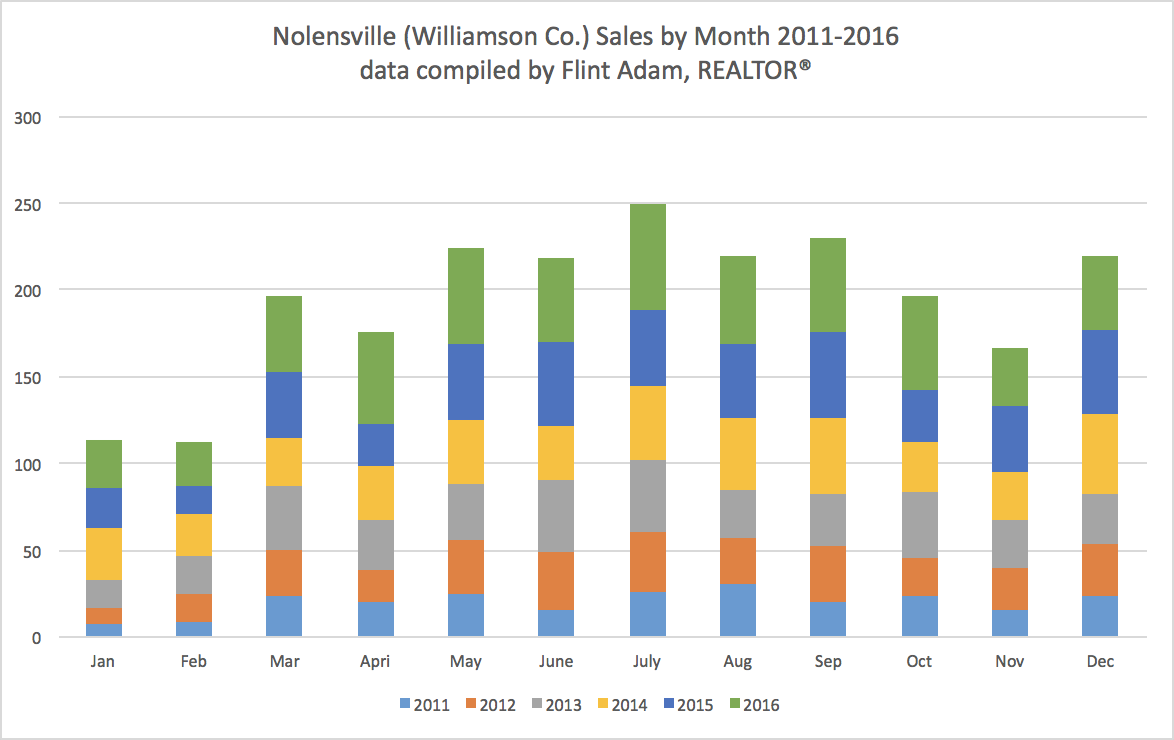
I built this graph to illustrate monthly sales in Nolensville over the past 6 years. April is that funky month where sales tend to dip.
My theory is that people are heading out on spring break in March, so fewer offers get made and there aren’t as many sales the following month.
You look at May and June, though, and we see the beginning of peak real estate season that carries through September.
At the time, I thought we may be simply experiencing a deeper dip than we were accustomed to, and that sales would bounce back up the following month.
I was a little concerned, though, mainly because of what I saw happening in my own Bent Creek neighborhood. In April 2016, there were thirteen neighborhood closings. In April 2017… that number fell to three. A 77% year-over-year drop.
One Month Becomes Two…
May 2017 didn’t get much better in Nolensville. I had a couple listings in Bent Creek that were slow-going. I asked around and heard similar stories from others. However, it wasn’t just a lack of offers being made that bothered me, it was lagging foot traffic that made the least sense.
This was the time of year when the market typically starts cranking. Elsewhere, there were plenty of signs the market still looked good. The Greater Nashville Association of Realtors reported great news in their May press release:
‘Greater Nashville made May a record-setting month by continuing year-over-year sales gains,” said Greater Nashville REALTORS President Scott Troxel. “In spite of the low supply levels, Middle Tennessee joins the majority of the country in experiencing healthy market trends.”’
Meanwhile, the Williamson County Association of Realtors similarly had an optimistic report stating year-over-year gains of 2.1 percent.
Nolensville (Williamson Co.), though… well, we had a 25% drop in year-over-year sales.
Price Reductions Rear Their Ugly Head…
I was keeping my clients up to date on the marketplace – they were growing concerned. A lot of other people were too, as indicated by the number of price-reductions I began seeing.
I typed up a report on June 19th for one client in Bent Creek and noted the price reductions I had seen in the neighborhood over the past three months:
5005 Burke Trail – dropped $5,500.
6021 Christmas Drive – dropped $10,000 to $439,900. Sold for $435,000.
6006 Fishing Creek – dropped $10,000 to $469,990.
1380 Jersey Farm Rd – dropped $24,900 to $435,000. Sold for $422,000.
4771 Jobe Trail – dropped $25,000 to $399,900.
3259 Locust Hollow – dropped $30,000 to $399,900.
3264 Locust Hollow – dropped $10,000 to $469,000.
112 Lodge Hall – dropped $30,000 to $489,900.
4868 Powder Spring Rd – dropped $16,000 to $429,000.
4656 Sawmill Pl – dropped $16,700 to $547,000.
4644 Sawmill Pl – dropped $30,000 to $559,900.
4619 Van Leer Ct – dropped $16,900 to $363,000. Sold for $355,000.
What you’ll notice there is contradictory to something reported elsewhere. In Nolensville, we were not facing an inventory problem. We were facing a pricing-problem. In my 2017 real estate predictions blog I wrote at the beginning of the year, I forecasted that a turn in the market was coming… it just began happening earlier than even I anticipated.
A June Swoon…
Surely the Nolensville market would rebound in June, right? The official numbers have yet to be released by the Williamson County Association of Realtors, but I have pulled sales records from MLS and can tell you where things stand:
June 2016 Nolensville (Williamson Co.) residential closings – 48
June 2017 Nolensville (Williamson Co.) residential closings – 38
Year-over-year percentage change in overall closings – down 21%
When you analyze three consecutive months, that’s called a quarter. When the analyzed quarter is the launch of the traditional real estate selling season, that’s called a very important quarter. When your very important quarter looks like this… -21% / -25% / -21%… that’s called a trend.
UPDATE BASED ON READER QUESTION: Inventory is not the problem here. According to the Williamson County Association of Realtors:
-
June 2016 Nolensville (Williamson Co.) inventory – 162 homes
-
June 2017 Nolensville (Williamson Co.) inventory – 189 homes
-
there was 17% higher inventory last month but 21% fewer sales year-over-year
-
The Nolensville real estate market is officially sliding, folks. It’s time to accept that.
Price Reductions Are Becoming More Common…
I combed through MLS and reviewed all of the Nolensville (Williamson Co.) RE-SALE activity (excluding new construction) in the 2nd quarter of 2017 and found the following:
- 156 existing single-family residences were on the market
- 53 of the above homes (or 34%) were price-reduced
Bent Creek, alone, made up a quarter of those price-reductions. The neighborhood struggled through the second quarter with underwhelming sales.
- April 2016 Closings = 13 April 2017 Closings = 3 % Change = -77%
- May 2016 Closings = 19 May 2017 Closings = 5 % Change = -74%
- June 2016 Closings = 9 June 2017 Closings = 4 % Change = -56%
Just look at that figure. Bent Creek sold fewer homes in the 2nd quarter of 2017 than it did just in the month of April 2016.
The Biggest Competitor…
I noted, above, that I have spoken with buyers opting to not come to Nolensville and instead look at less expensive options elsewhere. I believe that has been one hurdle for resales. There’s another hurdle – new construction.
Through the end of the 2nd quarter 2017, there were 237 single-family home sales in Nolensville (Williamson Co.). Of those, 144 of them (61%) were new construction closings. Six out of ten who decide to buy in Nolensville will build new.
And why not? The median price of new construction that has closed so far this year in Nolensville is $560,510. The median price of resales available on the market today in Nolensville is $539,900.
To put it another way – there are more new construction homes (35) available today for sale under $500,000 then there are resales (29) in Nolensville (Williamson Co.).
Get It Right…
If you want to sell your home today, getting the price right – and understanding its marketability, flaws, needed repairs/updates, and timely market analysis – are imperative.
We’re in July, and there’s now just over a month until school starts again. This is typically a busy time but the window of prime-opportunity will arguably begin closing in about 6 weeks.
Real estate sells year round, true, but buyers are out in full force right now. Get your pricing and marketing right and sell that house now!
I’m available for a no-obligation, home-sale consultation if you’re interested in learning more.
*Note: The above information cites Williamson County sales data for Nolensville, Tennessee. There are, of course, a percentage of Nolensville properties that also exist in Davidson and Rutherford counties, but for the purpose of this blog I am focusing on Williamson County since a majority of Nolensville addresses fall within this geographic area.
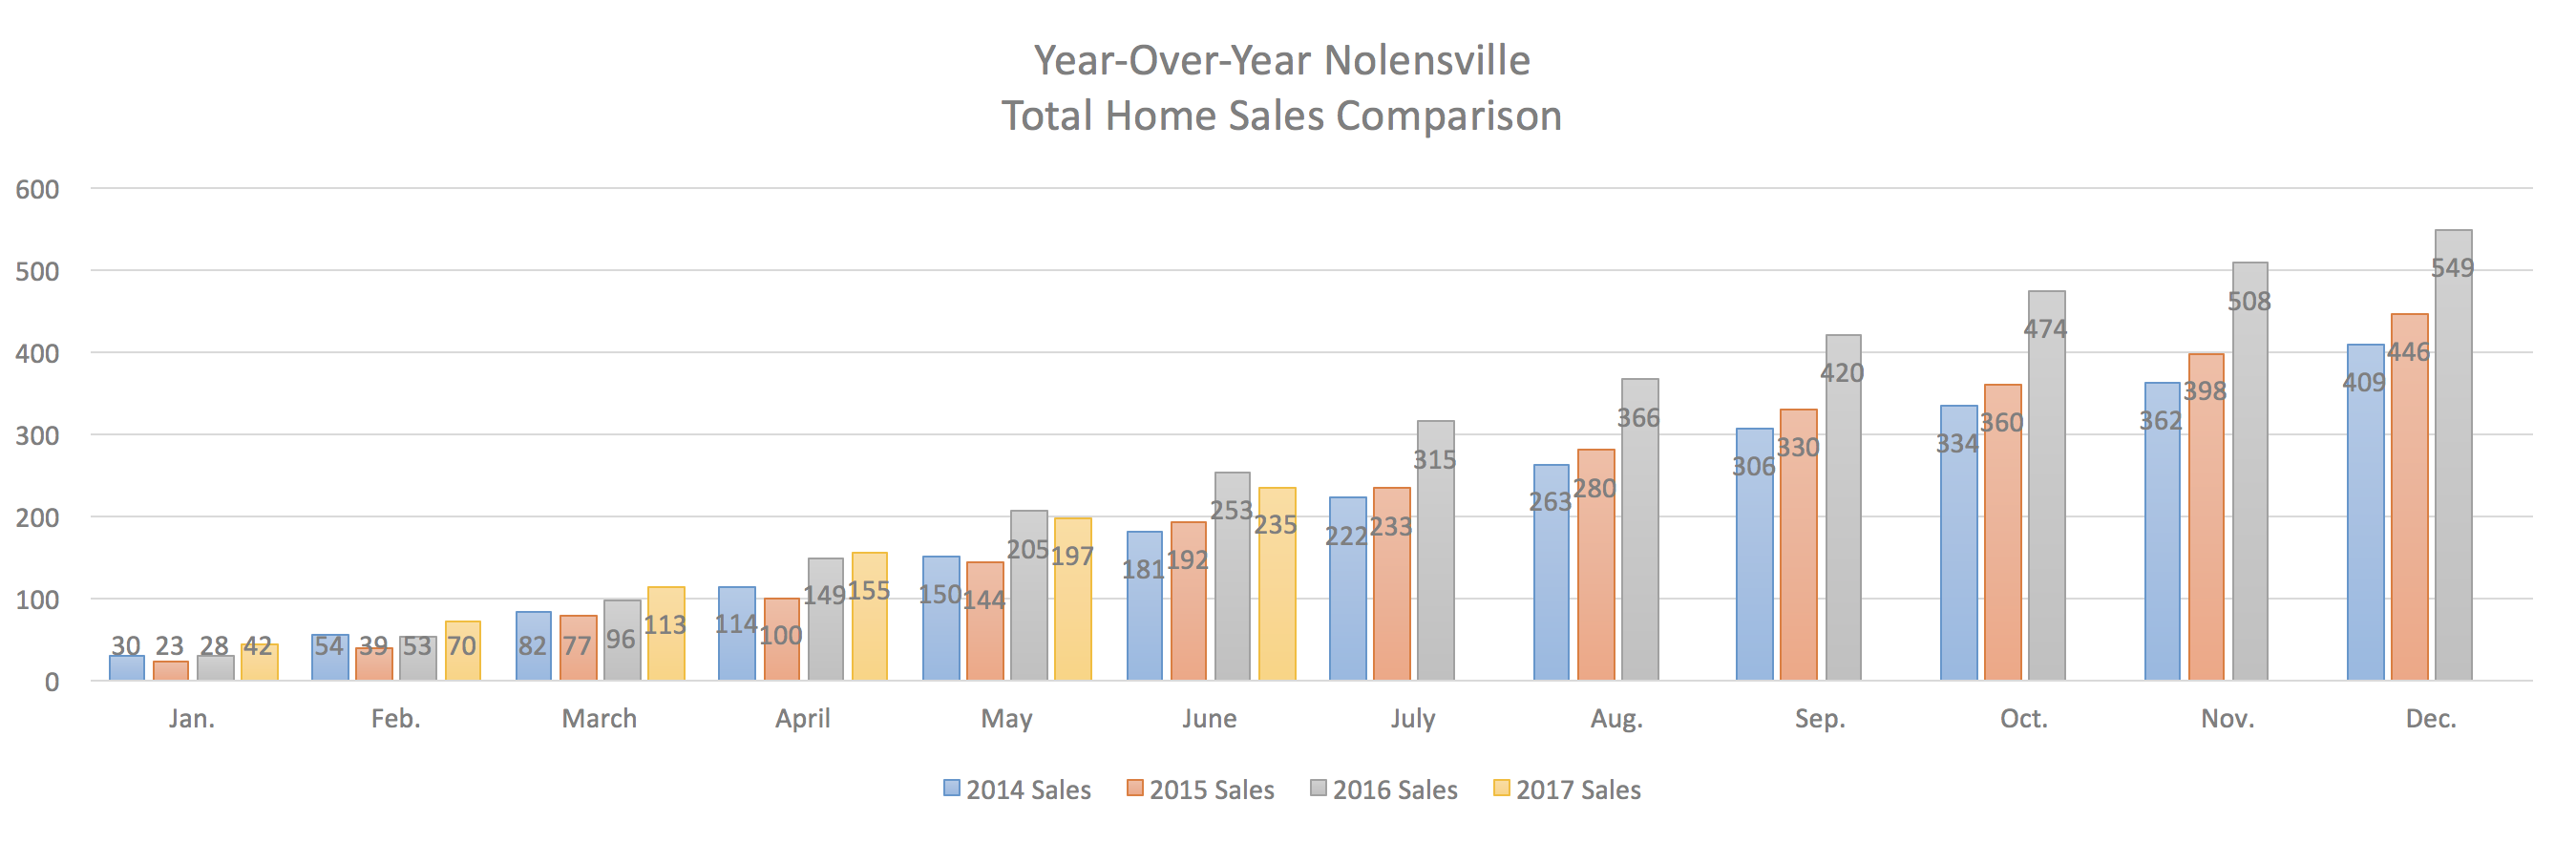
Residential Sales Lag In 2nd Quarter…
It’s been a while since we’ve seen something like this in Nolensville – an entire quarter of sales that lagged the prior year.
2016 was record-setting and a difficult pace to match. The silver lining is that we remain 22% above 2015’s pace, so the news is not all bad. Perhaps we’re just spoiled?
Interested in up to date Nolensville TN real estate sales figures? I’ll email you an HOURLY UPDATED look at Nolensville real estate activity including what has gone pending, price-reduced, and withdrawn. Just shoot me an email with your name and preferred email address to flint@homesaroundnashville.com
Mortgage Rates Rise…
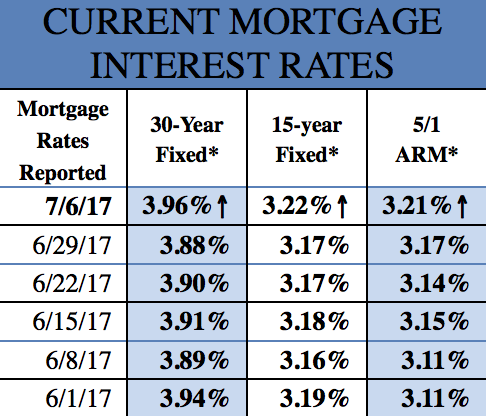
From My Mortgage Insider.com: After weeks of dropping, mortgage rates finally began to turn upward once again.
Based on the size of the jump, it would not be surprising if mortgage rates continued to climb over the coming weeks.
Over the past week, mortgage rates rose to 3.96%, an increase of eight basis points (0.08%) from the previous week. It’s a large single-week increase and one of the largest in the past year.
Mortgage rates followed the 10-year Treasury yield this past week. Typically, mortgage rates follow the yield, but rates in 2017 have seemed to buck that trend.
I’m a Nolensville TN resident… I’m a Nolensville TN Realtor®… and I always offer a complimentary, no commitment, no pressure Comparative Market Analysis for my neighbors. Please let me know how I may assist you in the sale or purchase of a Nolensville property.