


Nolensville Real Estate by County: Williamson, Davidson and Rutherford | September 2026
Nolensville is often discussed as one housing market, but in reality the zip code extends from Williamson into Davidson and Rutherford counties… and September’s numbers show why the county line matters.
My September 2026 Nolensville real estate market report focuses on the Williamson County portion of Nolensville, which I use for continuity in my monthly reporting. However, buyers and sellers should also understand how the smaller Davidson and Rutherford County sections compared.
September 2026 Nolensville Housing Market Comparison
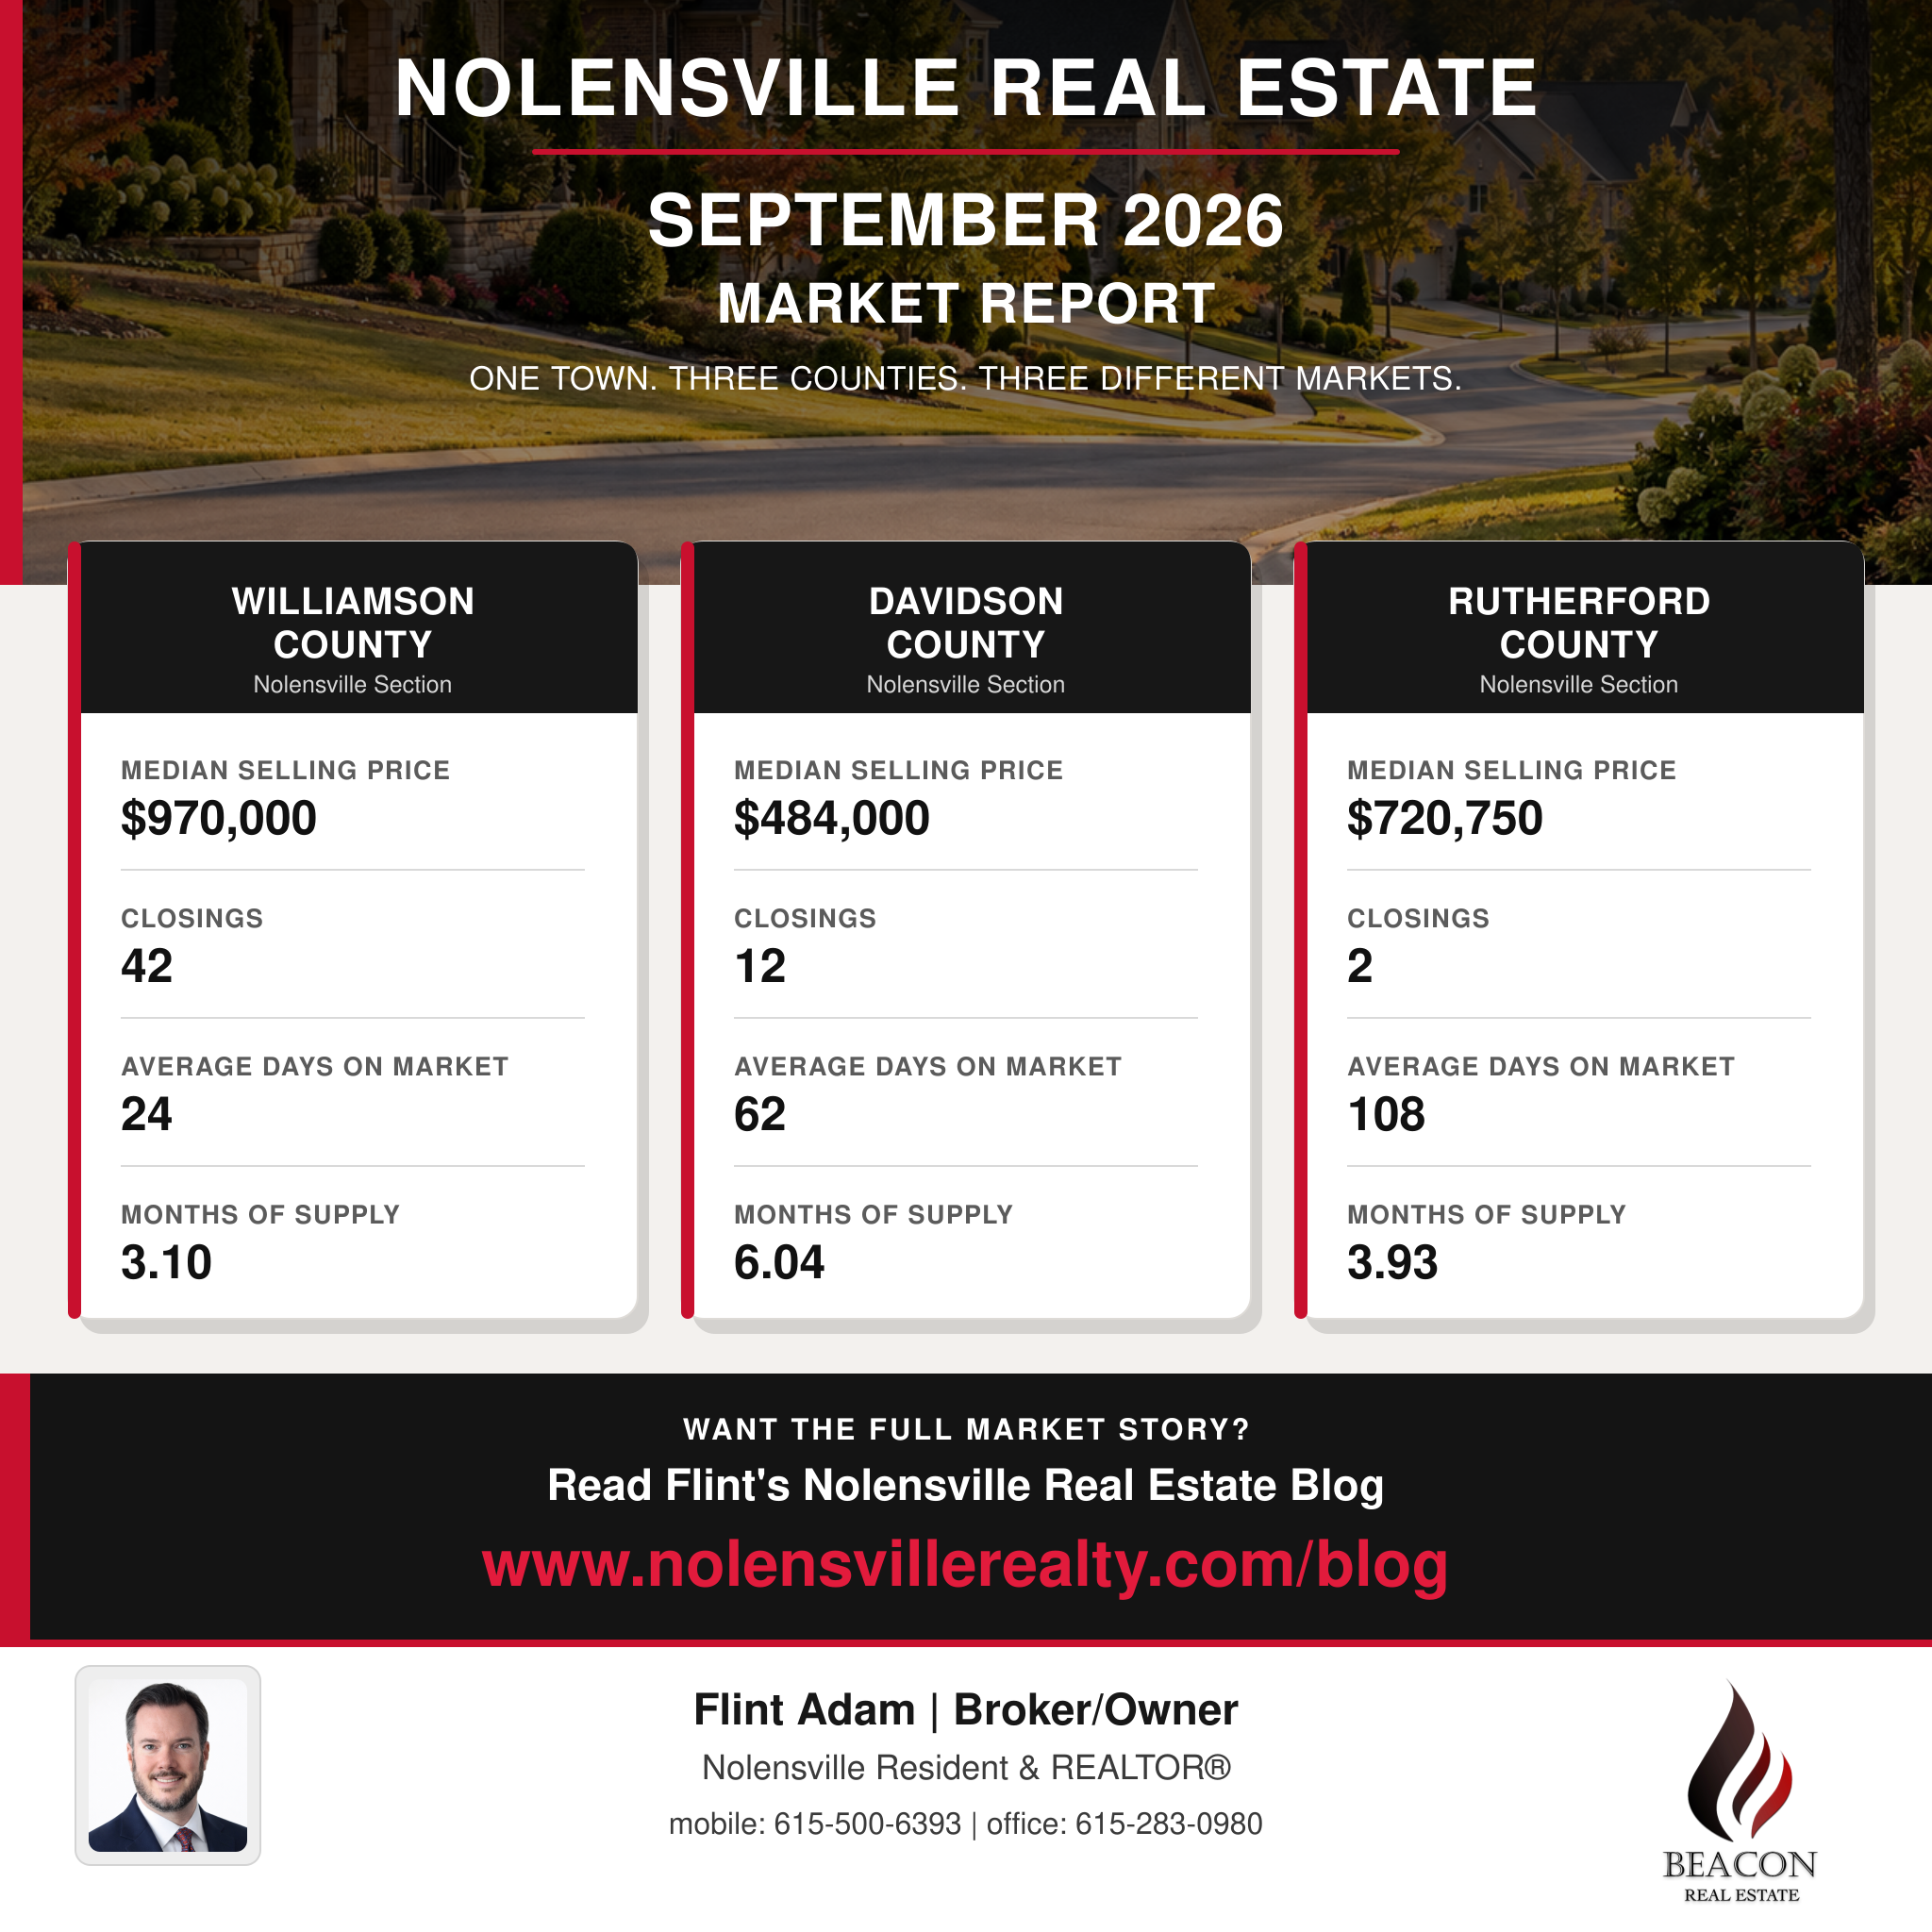
These figures should not be interpreted as three versions of the same housing stock. The age, size, condition, lot, school zoning, location and mix of homes sold can vary considerably across the three county sections.
Williamson County Led in Sales and Market Speed
The Williamson County portion of Nolensville was the most active of the three markets. Its 42 closings represented 75% of the 56 combined September sales across all three county sections.
Closings increased 110% from September 2025, while the median sale price rose 3% to $970,000. Closed homes averaged only 24 days on market, and months of supply fell to 3.1.
That combination – more sales, faster closings and tighter supply – made Williamson County the strongest and most seller-leaning portion of the Nolensville housing market during September.
Davidson County Offered Buyers More Breathing Room
The Davidson County portion of Nolensville recorded 12 closings, up 50% from eight sales in September 2025. Its median sale price was $484,000, approximately 50% below the Williamson County median.
Homes that closed averaged 62 days on market, compared with 24 days in Williamson County. Davidson County also had 6.04 months of supply, the highest of the three Nolensville sections.
That points to a market with more negotiating room for buyers. However, demand was not absent: 15 homes went under contract during September, a 67% year-over-year increase, and months of supply declined from 9.22 a year earlier.
In other words, Davidson County remained more buyer-friendly than Williamson County, but it was tighter and more active than it had been one year earlier.
Rutherford County’s Small Sample Requires Caution
The Rutherford County portion of Nolensville produced only two September closings, down from four in September 2025. The median sale price was $720,750, while closed homes averaged 108 days on market.
Months of supply increased to 3.93, up from 2.71 a year earlier.
With only two closed sales, Rutherford County’s median price and days-on-market figures can be influenced significantly by the characteristics of one property. These numbers are worth monitoring, but they should not be treated as evidence that every home in this section lost value or requires more than 100 days to sell.
For an individual Rutherford County property, neighborhood-level comparable sales will provide a much more reliable valuation than the monthly median alone.
What This Means for Nolensville Buyers and Sellers
September demonstrated that there is no single answer to the question, “How is the Nolensville real estate market?”
Williamson County had the highest prices, most closings, shortest marketing time and lowest housing supply. Davidson County offered the most inventory and the greatest apparent leverage for buyers. Rutherford County sat between the other two in price and supply, but its extremely small sales sample makes broad conclusions difficult.
A lower countywide median also does not automatically mean that a comparable home is a bargain. Buyers should evaluate the exact neighborhood, school zoning, property condition, construction quality, lot and competing inventory. Sellers should use comparable sales from the correct county section rather than relying on a broad Nolensville average.
If you are buying or selling a home in Nolensville, I would be happy to help you understand what the market is doing in your specific neighborhood and price range.