


If you’re trying to figure out what a Nolensville home might sell for this fall, the number I’d start with is 18.
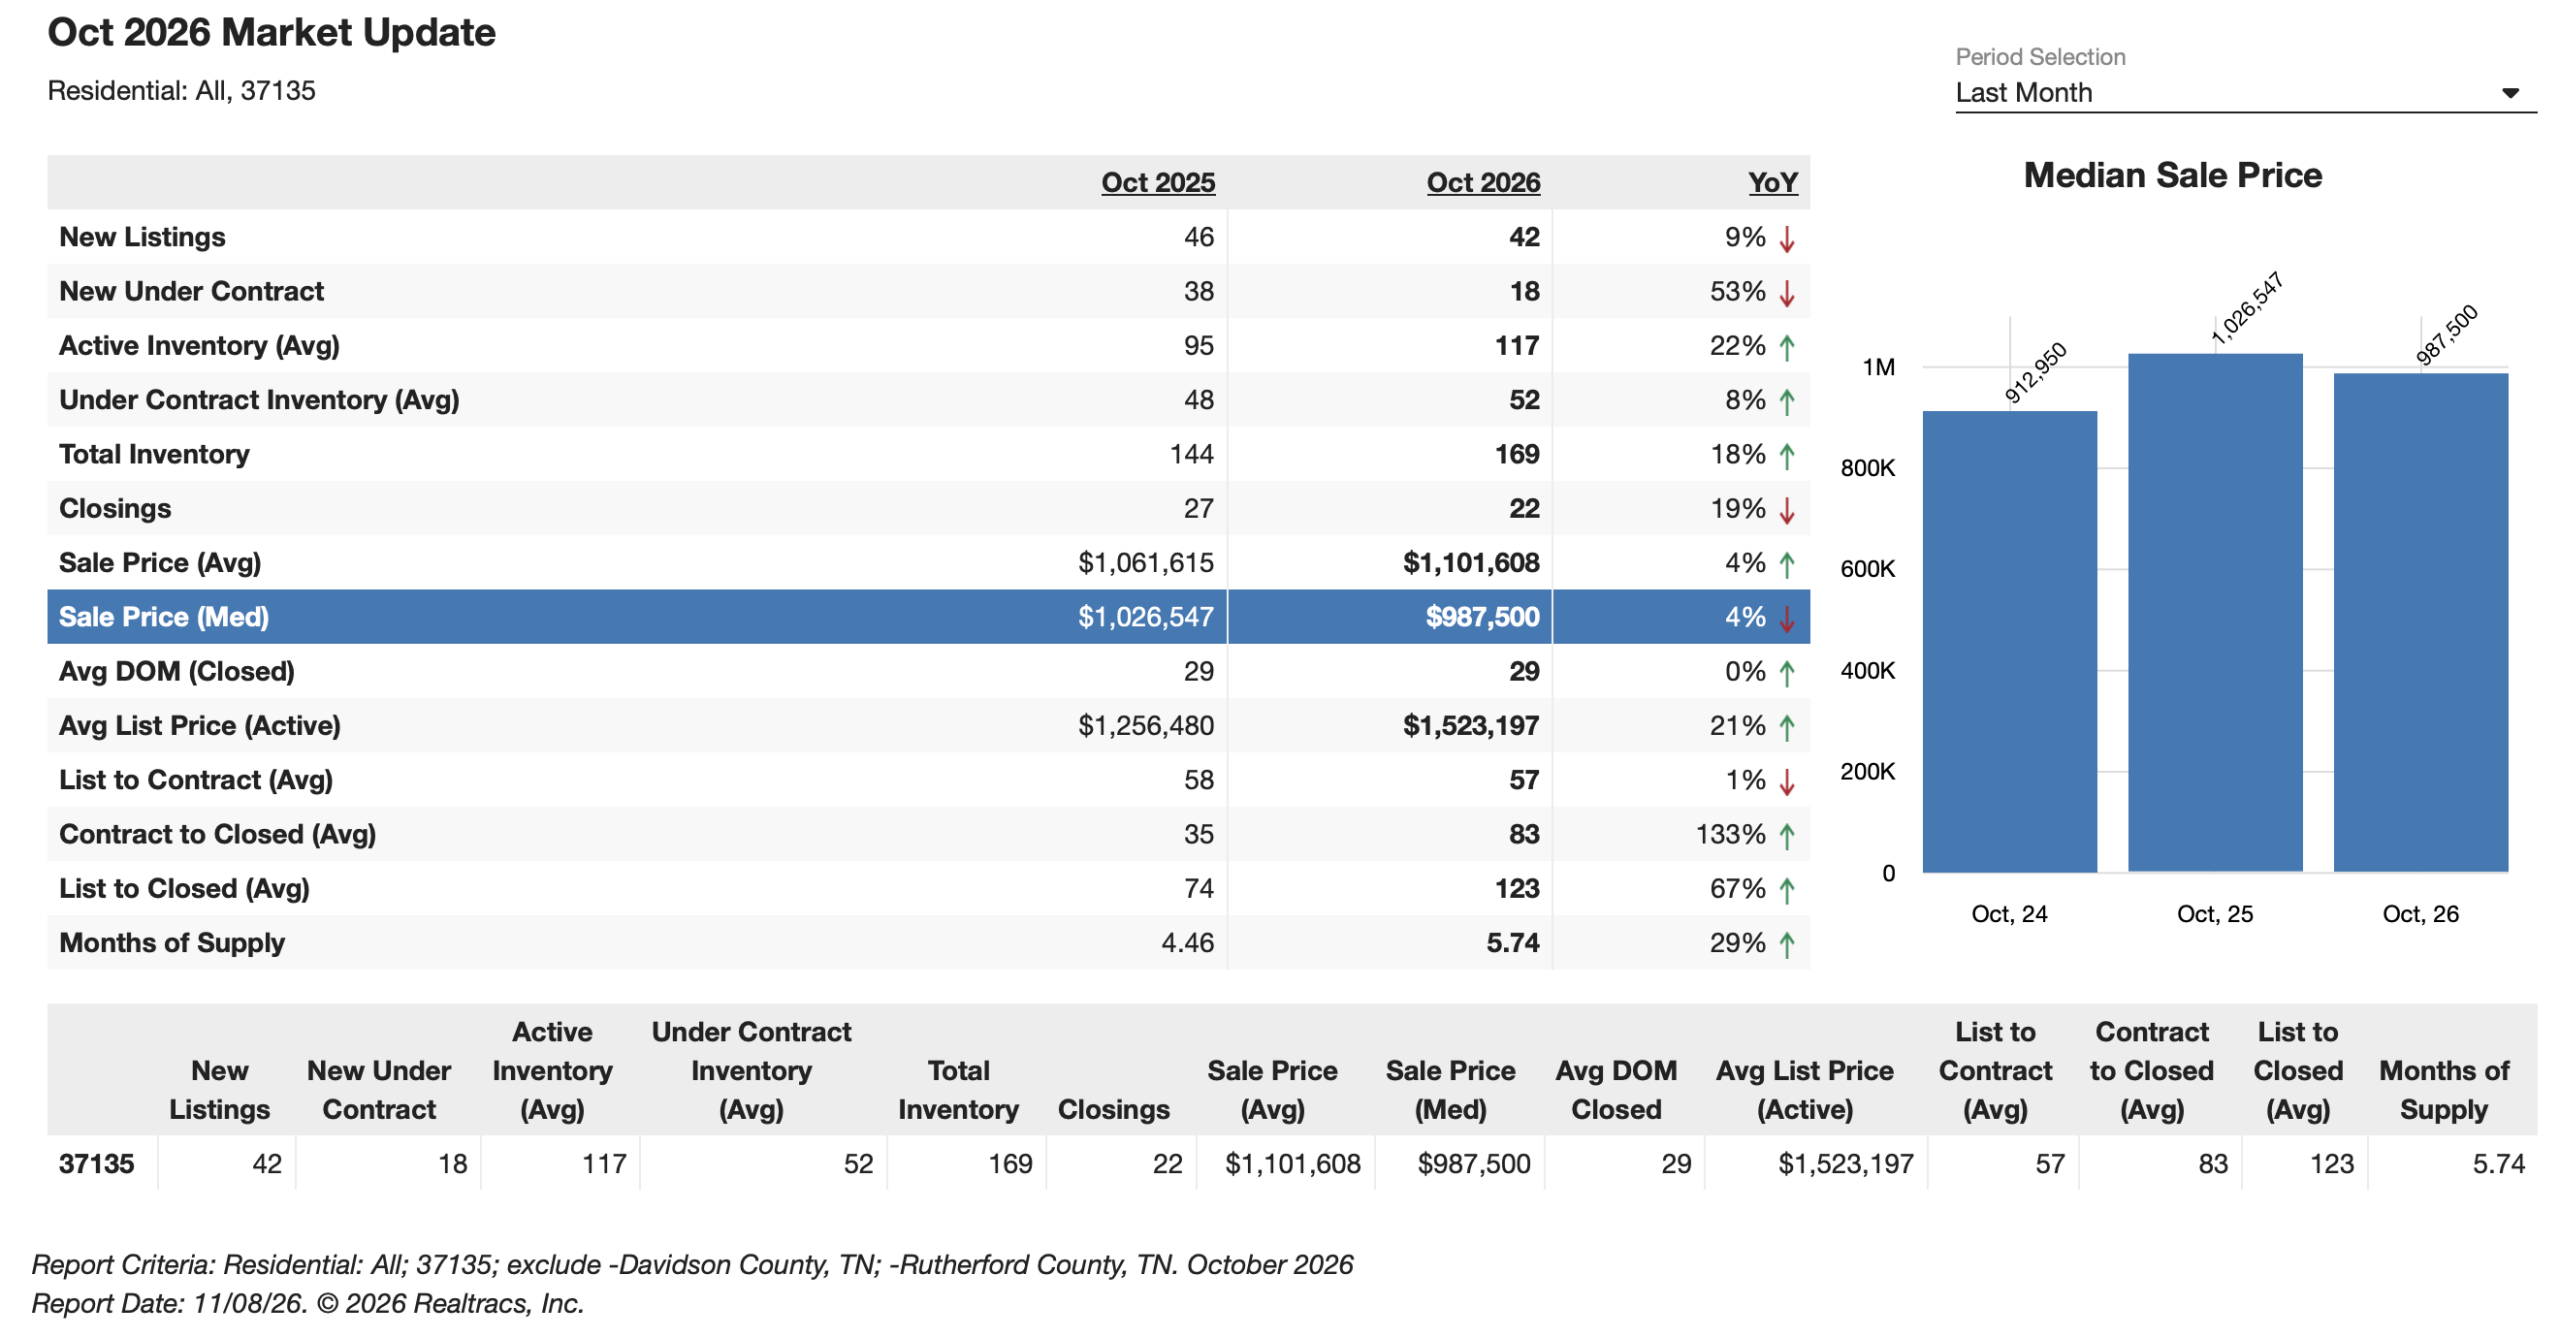
That’s how many homes went under contract in the Williamson County portion of Nolensville in October. A year ago, it was 38. Meanwhile, the median selling price actually rose from September to $987,500. If you stopped at the price headline, you could come away thinking the market got stronger last month.
However, I came away with a different take: buyers had more homes to choose from, made fewer visits, and the listings that found buyers spent more time on the market before going under contract. Yet, the homes that did sell still averaged 98.62% of their final asking price. There’s some room to negotiate here… how much depends a whole lot on which house you’re standing in.
As always, my monthly recap covers residential properties in the Williamson County portion of Nolensville – where most Nolensville homes are located. I’ll break out some Davidson and Rutherford County data separately in the coming days. For a look at how we got here, see my September Nolensville market report.
October 2026 Nolensville home sales at a glance
The fall slowdown showed up first in contracts and showings
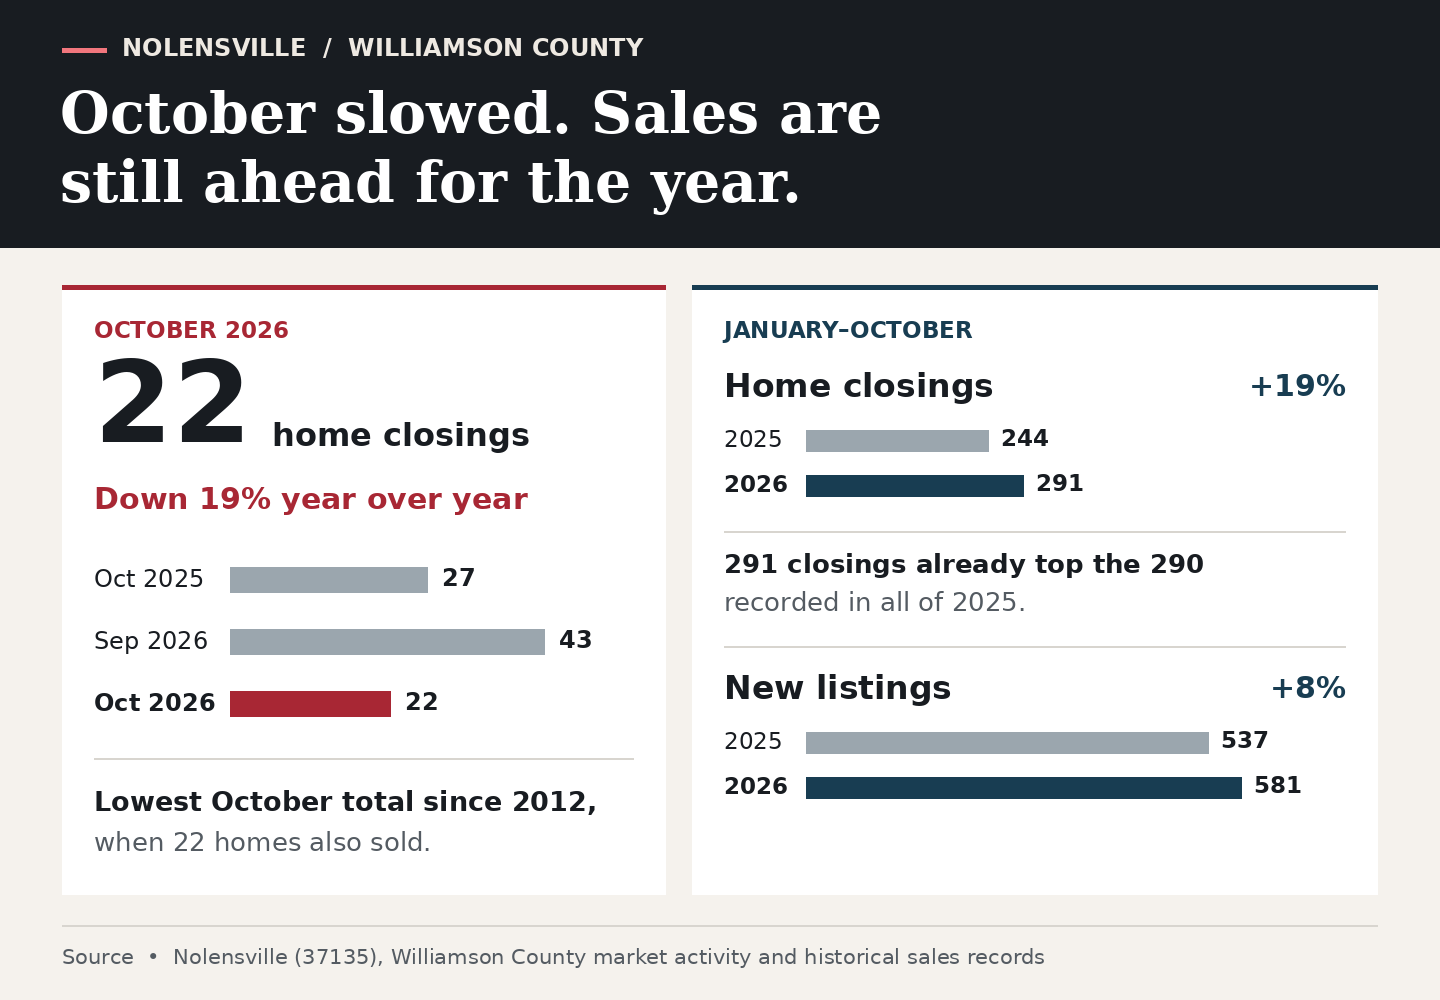
October’s 22 closings were down 19% from a year ago and were nearly half of September’s 43. Data from Realtracs (our local Multiple Listing Service), shows that 22 was the lowest October total since 2012, when we also recorded 22. And yet, through last month, 291 homes had sold in 2026, up 19% from 244 at the same point in 2025. We have already passed last year’s full-year total of 290 – the spring and summer did some heavy lifting! New listings were also up for the year through October, but by a smaller margin. There were 581 versus 537, an increase of about 8%.
The fall slowdown has been sharper in new contracts. Eighteen homes went under contract, down 53% year over year and 42% from September. October was the weakest month for new contracts so far this year. Closings tell me what made it to the finish line, but new contracts give me a better idea of how busy that finish line will be a few weeks from now.
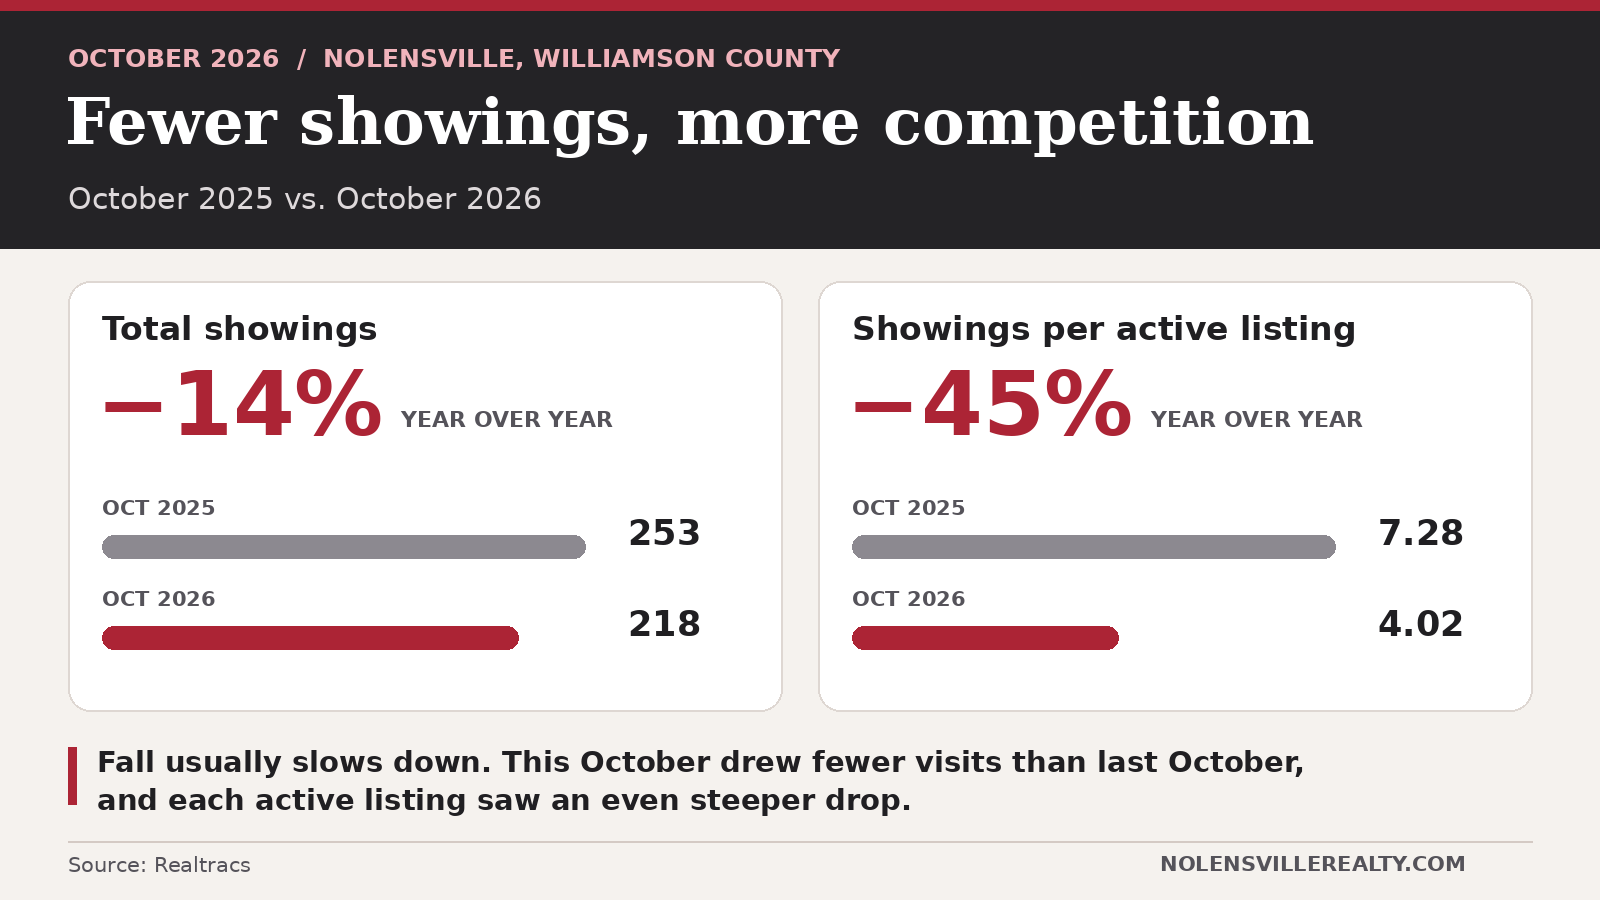
Meanwhile, Realtracs tracked 218 showings, down from 253 last October. That’s a 14% decline in total visits. The drop per active listing was much steeper, from 7.28 to 4.02, or roughly 45%. So there were fewer visits overall and more homes competing for them. Some fall cooling is normal, but the gap between this October and last October deserves more attention than the change of seasons.
Why inventory climbed with fewer new listings
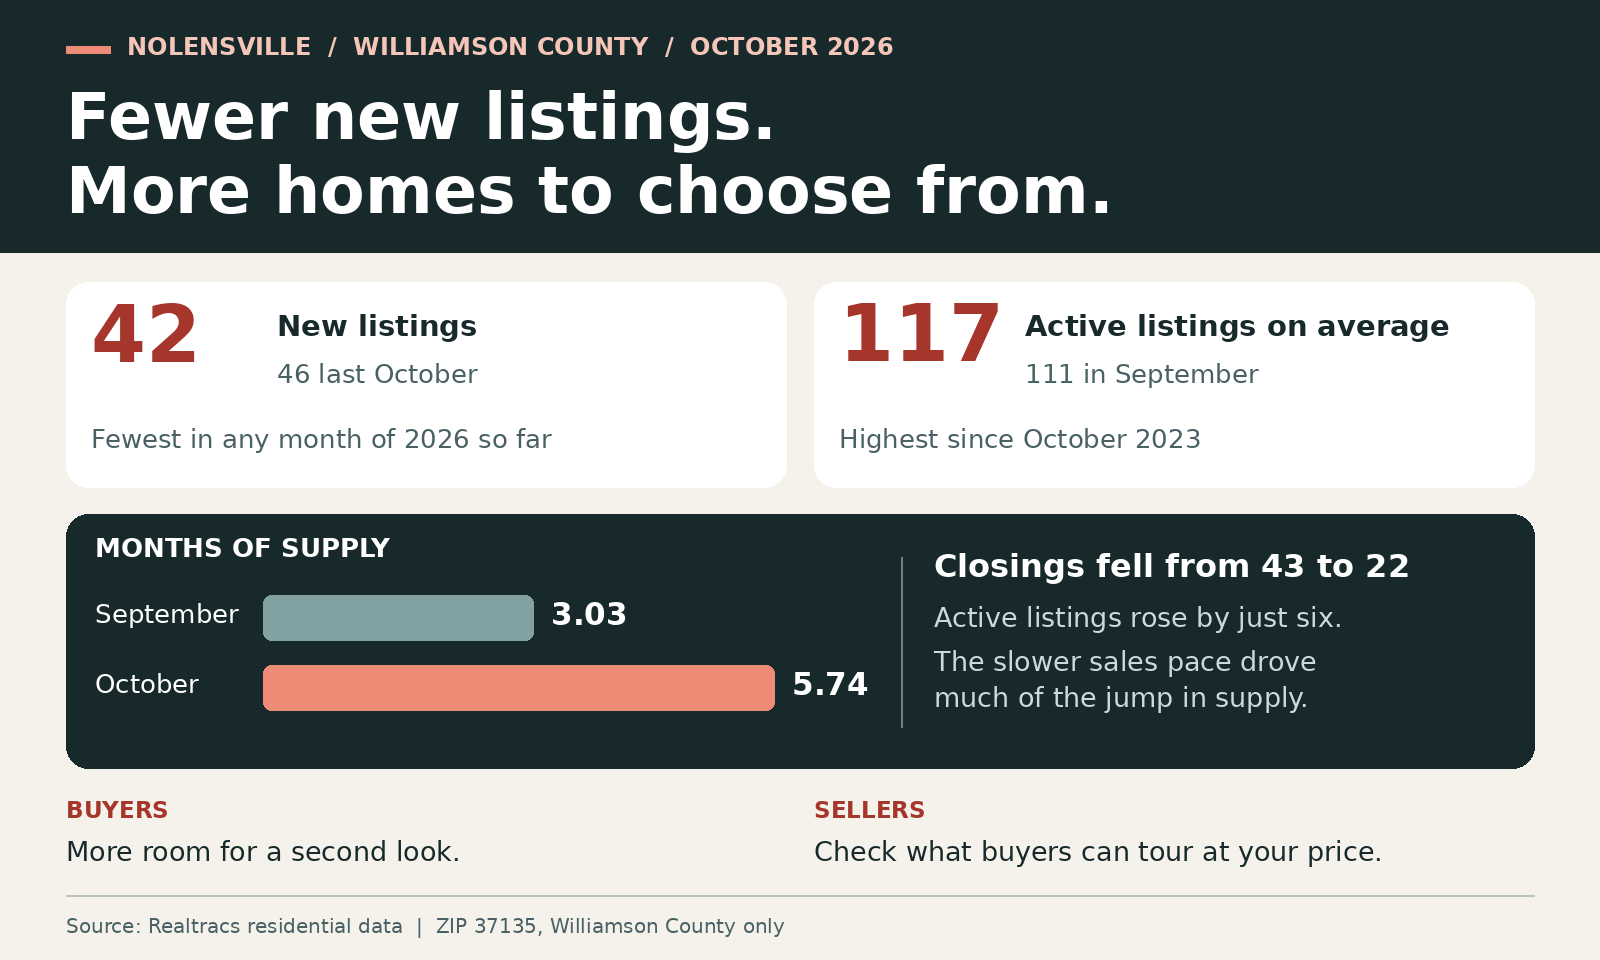
We had 42 new listings, down from 46 last October and the fewest of any month so far this year. At the same time, 117 homes were actively for sale on average, the highest amount going back to October 2023. Inventory can build even when fewer sellers come to market. Homes that were already listed have fewer new contracts taking them off the active market.
The October data put Nolensville at 5.74 months of supply, up from 3.03 in September. (Months of supply puts available inventory in the context of how quickly homes are selling). We added six active listings on average from September, while closings fell by 21. The slower pace did much of the work.
What does that feel like if you’re shopping? Well, you can probably make a second trip through a few more homes than you could this spring. If you’re selling, look at what a buyer can tour at the same price this weekend.
What Nolensville buyers actually paid
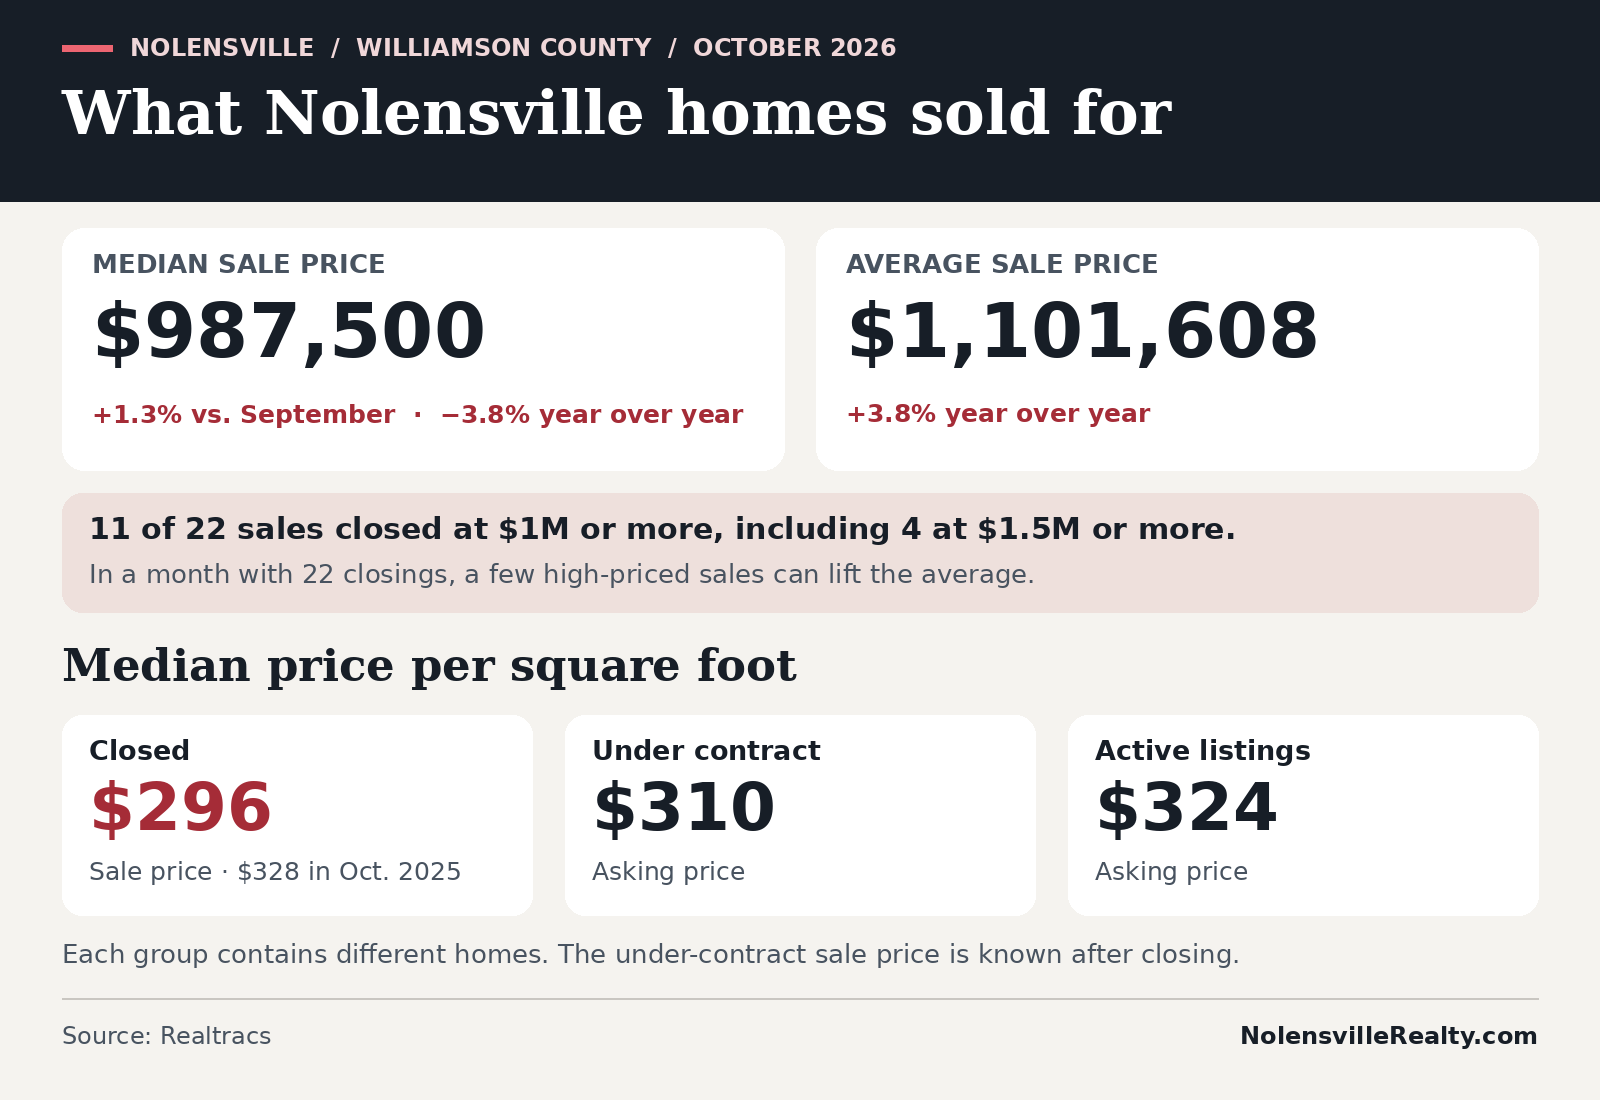
October’s $987,500 median sale price was up 1.3% from September and down 3.8% from October 2025. The average moved in the opposite direction from the median year over year, rising 3.8% to just over $1.1 million. Eleven sales closed at $1 million or more, including four at $1.5 million or more. When you have 22 sales in a month, a few expensive closings can move the average quite a bit.
The median closed price per square foot was $296, down from $328 a year ago. For comparison, the median asking price per square foot was $324 for active listings and $310 for homes under contract. That last figure is the asking price on a home that has a contract – we don’t learn the actual sale price until it closes. The three groups also contain different homes, so I’d use those numbers to get my bearings before pulling comparable sales.
The closings ranged from $490,000 on Fly Lane to $1,699,900 in Benington. Eight homes sold from $800,000 through just under $1 million, split evenly between the $800,000s and the $900,000s. Another four closed from $1 million through just under $1.25 million. Put it together and 12 of the 22 sales landed between $800,000 and just under $1.25 million.
Asking price versus selling price
- 12 of 22 sales closed below the final asking price, seven closed at asking, and three closed above it. All three above-ask sales were new construction.
- The average sale brought 98.62% of final list price and 98.10% of original list price. (Closing costs, buy-downs and other incentives can change what the seller actually takes home.)
- In some earlier research I did last week, I found that 29 of 67 active homes outside the new-construction group were priced below their original asking price – about 43%.
I like to look at when a home was reduced and what happened after the reduction. A seller who’s been sitting at the new price for six weeks may hear your offer differently than a seller who just lowered the price yesterday. Either way, I’d start with the comparable sales and work out which terms matter most to you. A smaller price cut with meaningful help at closing can be worth more to a buyer who needs to keep cash in the bank.
How long is it taking to sell a home in Nolensville?
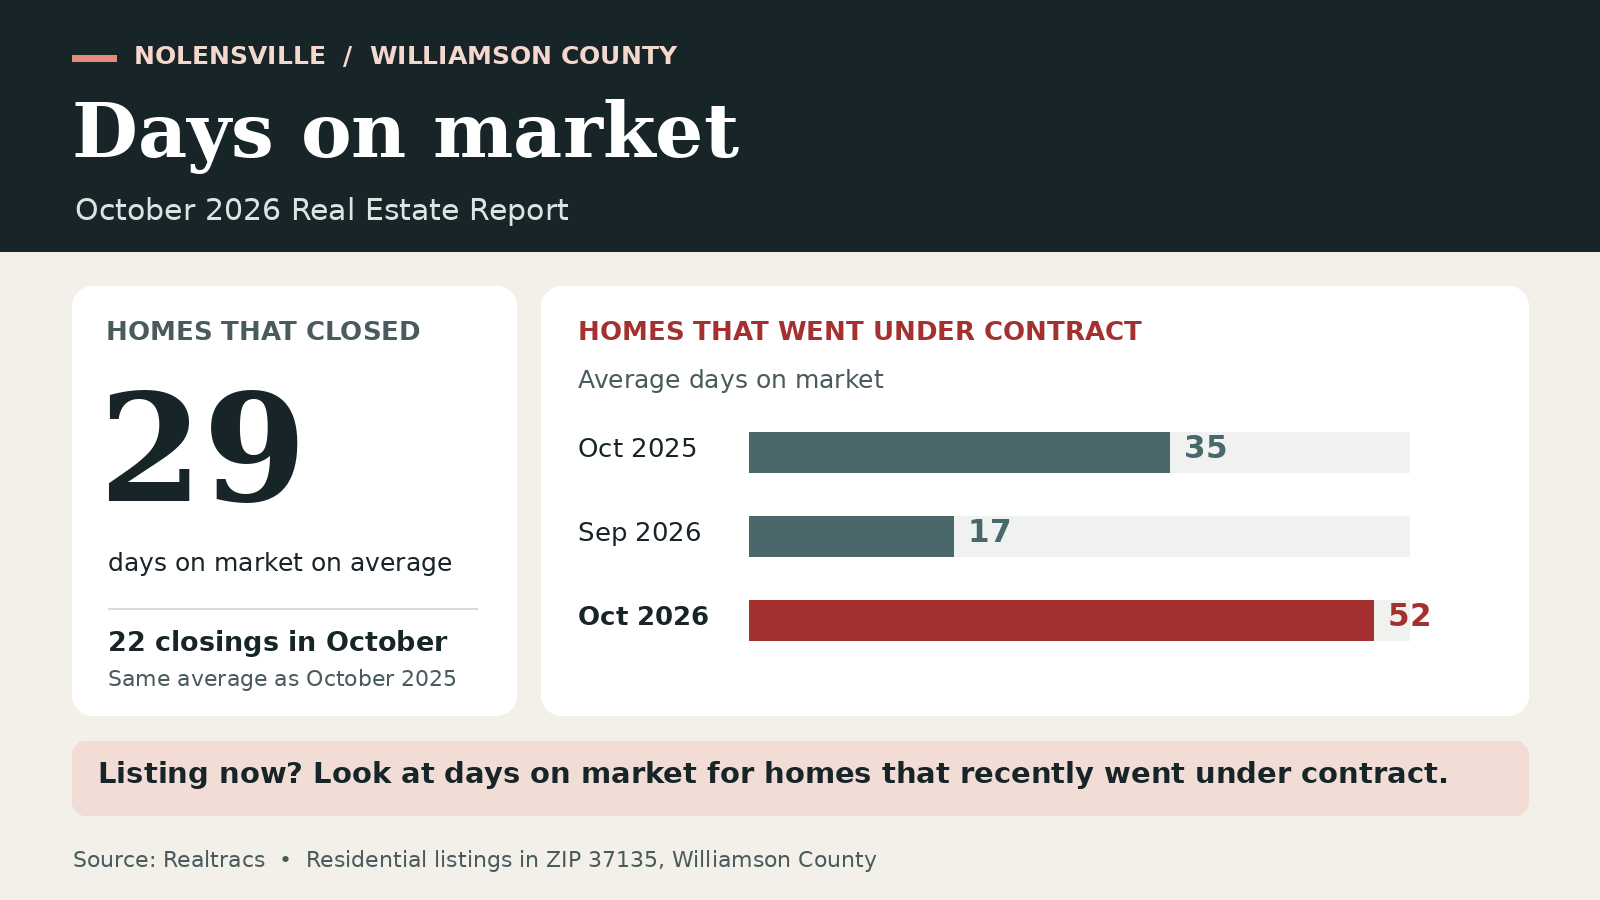
The 22 homes that sold averaged 29 days on market, the same as last October. That’s a useful number for the homes that found buyers and closed. The homes that went under contract in October, however, averaged 52 days on market, up from 35 a year ago and 17 in September. If you’re listing now, I’d pay closer attention to that second number when setting expectations.
How Nolensville compared with Williamson County and Greater Nashville
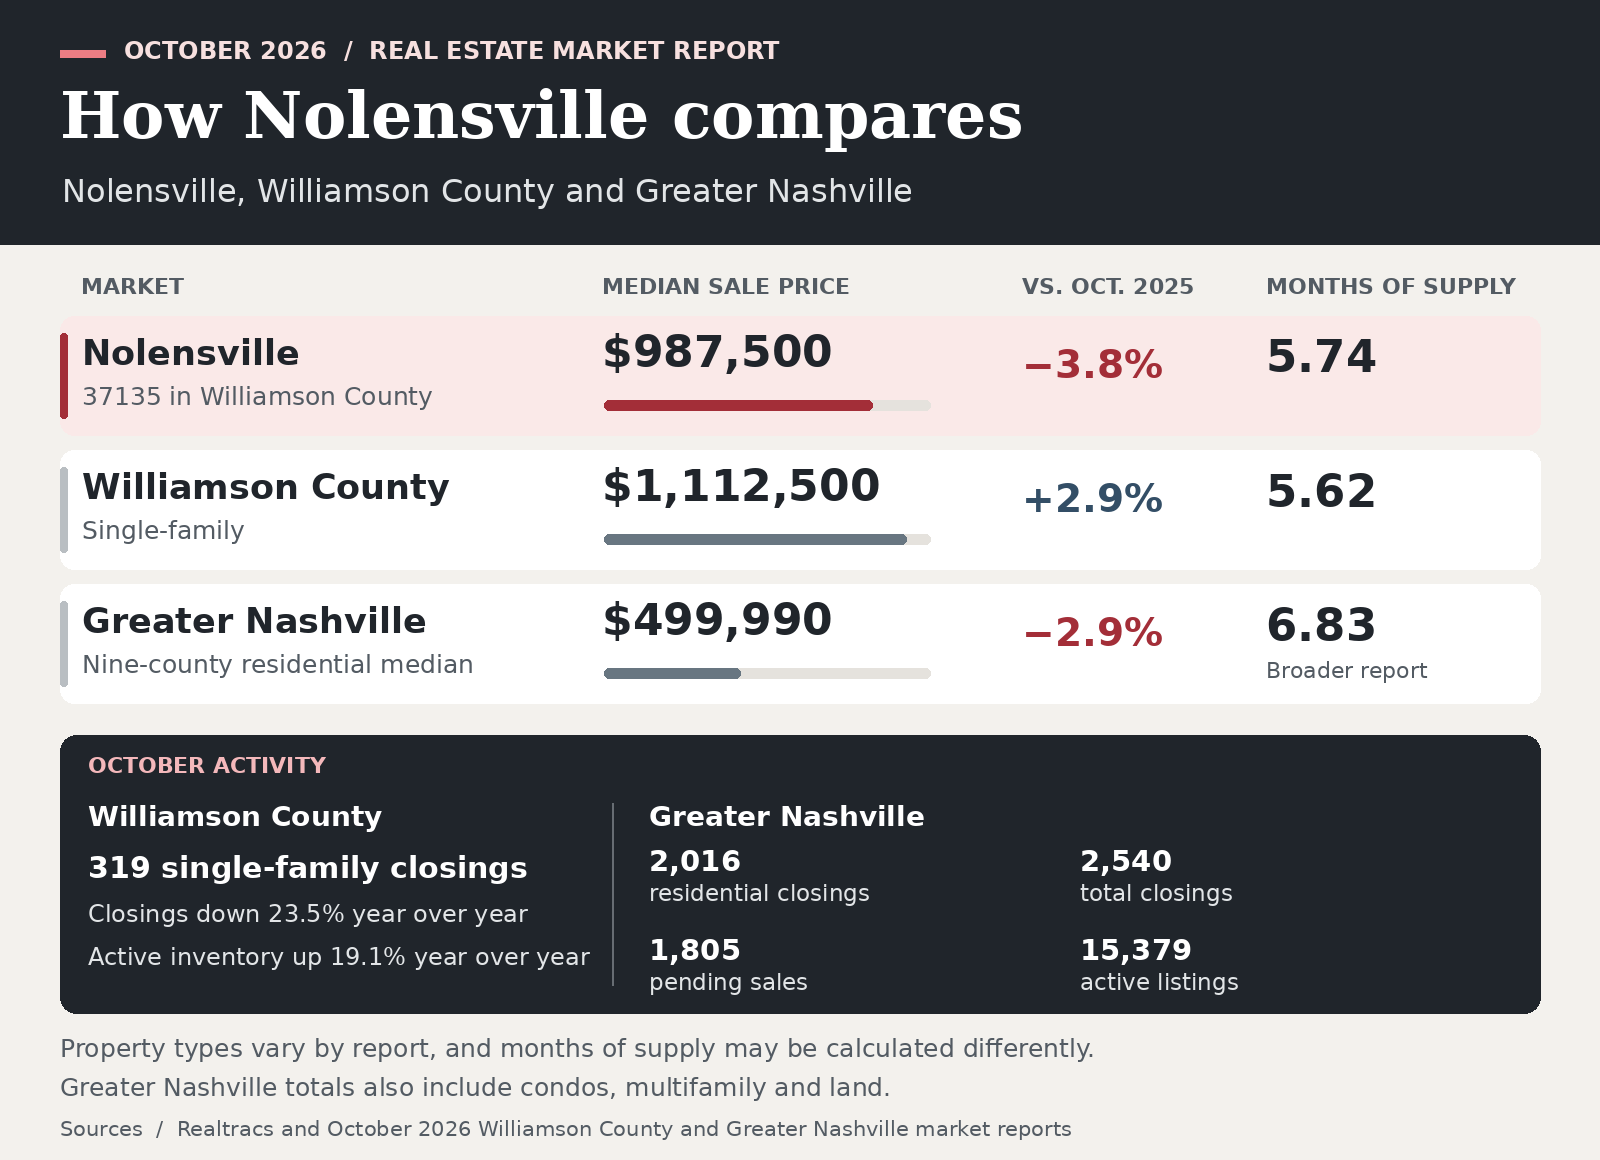
Greater Nashville reported 2,016 residential closings and 2,540 total closings when condos, multifamily and land are included. The broader report also showed 1,805 pending sales and 15,379 active listings. Nolensville’s median was nearly twice the nine-county residential median, while our supply was lower. If you’re pricing a home in Bent Creek or Benington, I’d use these figures to understand the competition and go right back to the neighborhood for your price.
What happened in the U.S. housing market in October
Realtor.com counted more than 1.18 million homes for sale nationwide, up 7.4% from last October and still 6.7% below pre-pandemic levels. New listings fell 7.5%, and the number of homes under contract fell 10.5%. That’s a familiar combination after looking through the Nolensville numbers. Fewer sellers came to market, but buyers pulled back enough that there were still more homes to choose from.
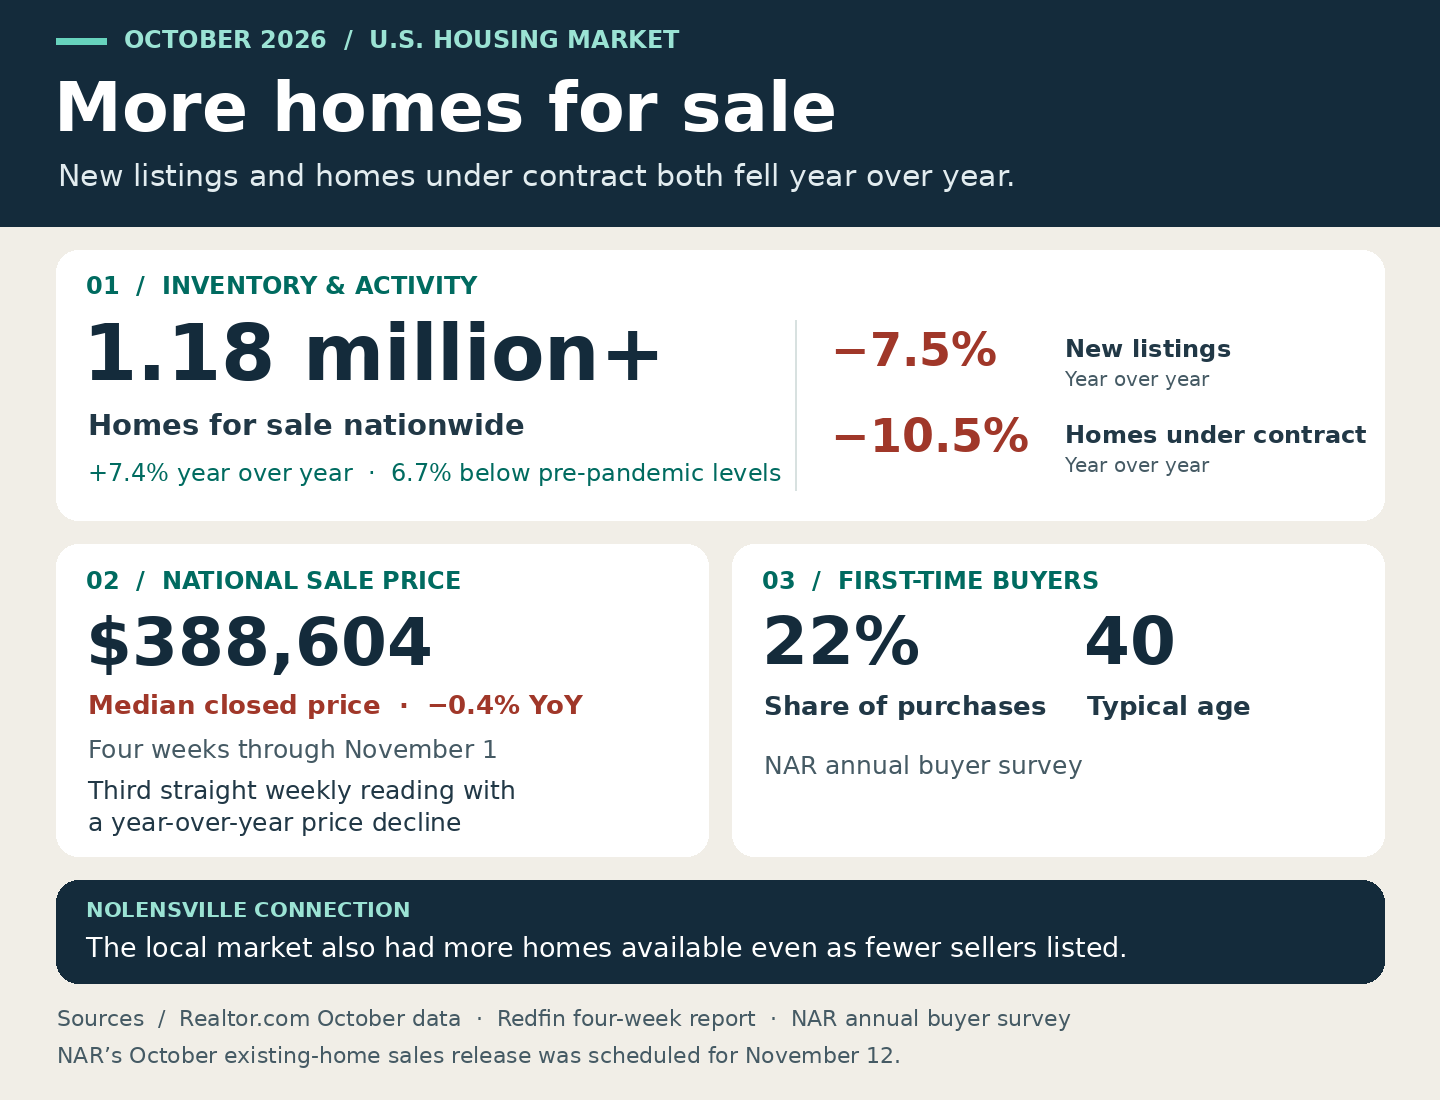
Meanwhile, Redfin’s four-week report through November 1 put the national median closed price at $388,604, down 0.4% year over year. That’s a modest move, but it was the third straight weekly reading with a year-over-year price decline after about three years of gains. Separately, NAR’s annual buyer survey found that first-time buyers accounted for 22% of purchases and that the typical first-time buyer was 40. Those figures help explain why a little more choice can be welcome news even when the payment is still a stretch. NAR’s official October existing-home sales release is scheduled for November 12.
New construction and builder incentives
Here in Nolensville, five of October’s 22 closings were new builds, including four in Fairington and one in Willow Ridge. The median among those five was about $1.485 million. The other 17 sales had a median of $927,000. That tells you what kinds of homes closed this particular month. I’d want to see a lot more than five transactions before drawing conclusions about the price of new construction across town.
In Greater Nashville and Tennessee, the Census permit data show two things worth keeping separate. Across the Nashville metro, about 17,050 housing units were authorized in the 12 months through September, down 11% from the prior 12 months. Roughly 12,700 of those were single-family units. Statewide, Tennessee authorized 4,535 housing unitsin September alone, up from 3,217 in August in the unadjusted series. Those numbers include apartments as well as houses. A permit is an early step, and a lot can happen before somebody gets the keys.
Across the South and the country, the broader Census South region, which includes Tennessee and its Southeastern neighbors, saw total housing permits down 3.2% year to date through September. National single-family permits fell 4% from August to an annualized pace of 845,000. Then the October NAHB/Wells Fargo builder confidence index fell to 29, its lowest since June 2012. 65% of surveyed builders reported offering sales incentives, while 43% said they cut prices.
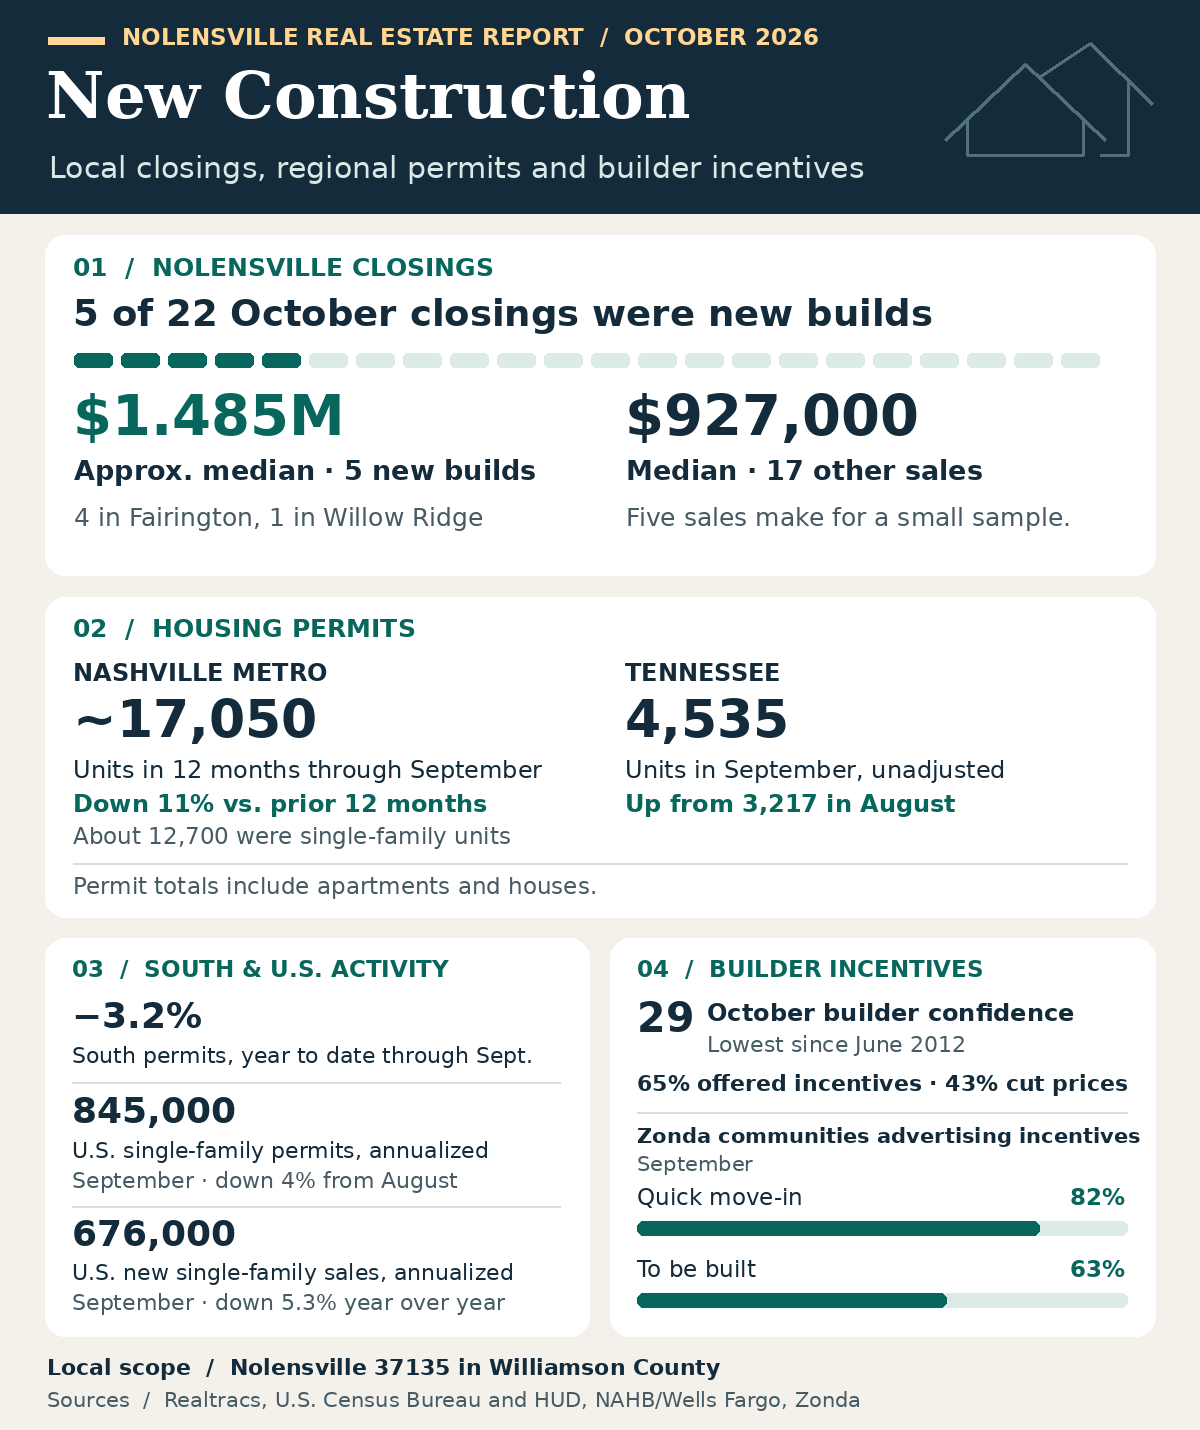
The latest federal new-home sales report, released in late October, put September sales of newly built single-family homes at an annualized 676,000, down 5.3% year over year. Zonda also found that 82% of the communities it tracks advertised incentives on quick-move-in homes in September, compared with 63% on to-be-built homes. That makes the completion date worth asking about even if your move is flexible.
If you’re comparing a Nolensville resale to a quick-move-in home, ask the builder to put the incentive in writing. Look at the actual closing costs, the rate and points, any preferred-lender requirement, and what the payment becomes when a temporary buydown ends. A kitchen you love and a payment you can live with both need to make it into the comparison. Sellers, run the same exercise. That new home down the road may be competing with you on the monthly payment even if its asking price is higher.
Mortgage rates eased heading into November
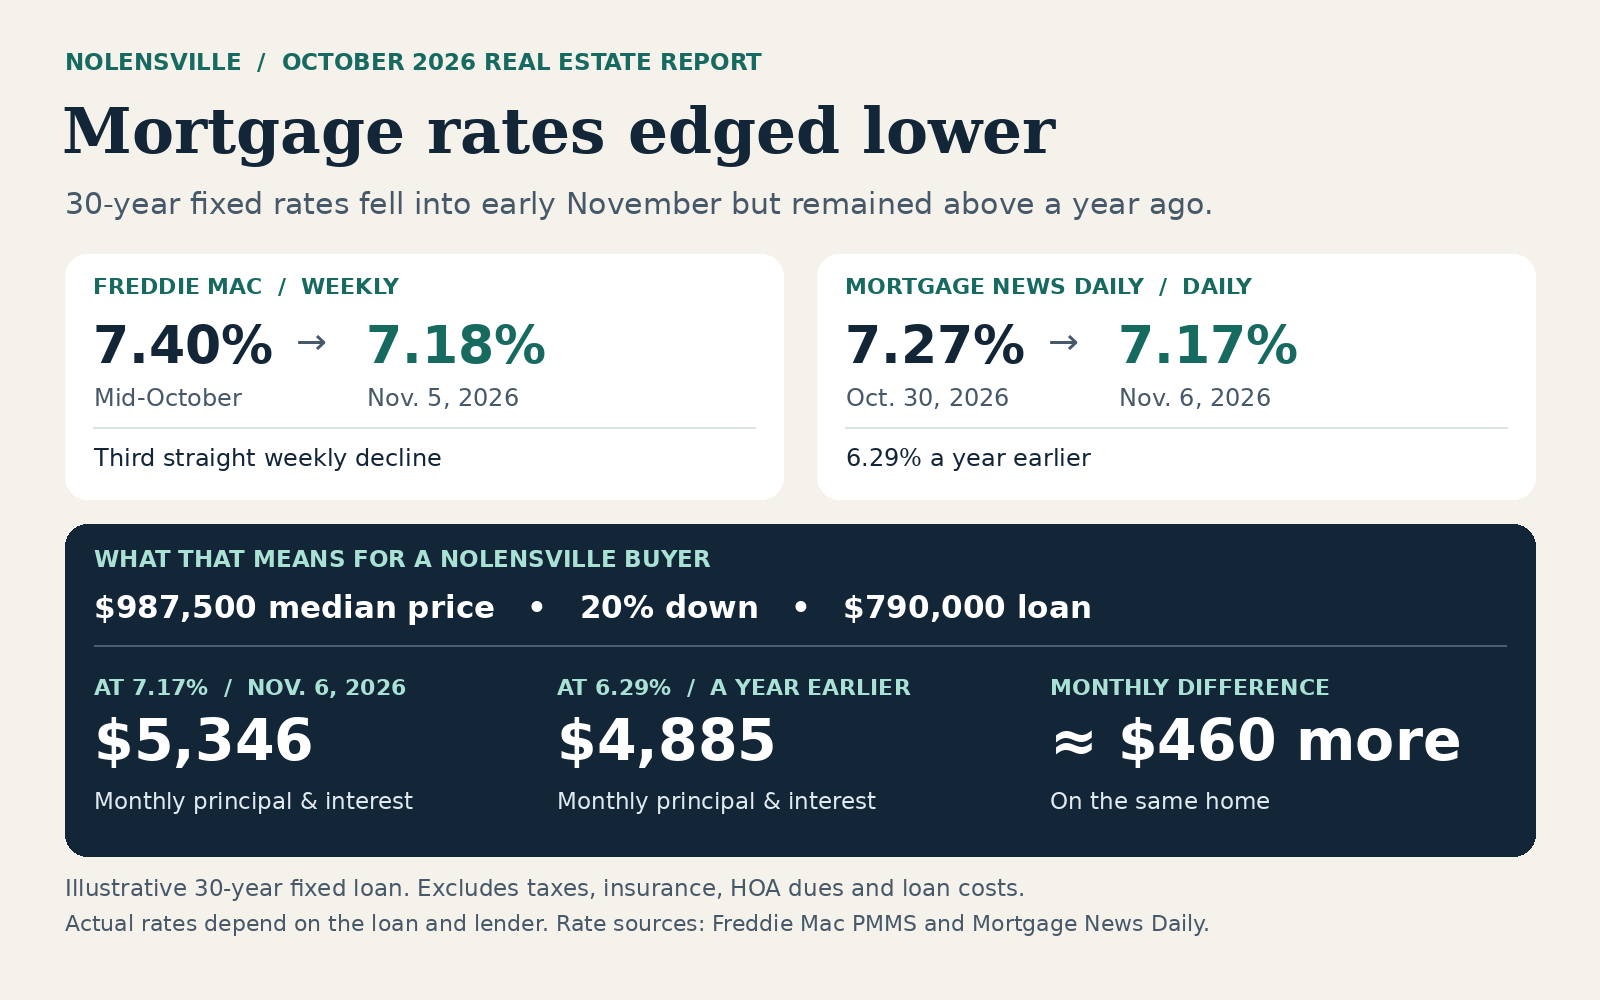
Freddie Mac’s average 30-year fixed mortgage rate was 7.40% in mid-October and 7.18% on November 5, its third weekly decline in a row. Mortgage News Daily’s separate daily index was 7.17% on November 6, down from 7.27% on October 30. A year earlier, that daily index was 6.29%.
Here’s what that looks like at Nolensville’s $987,500 median price. With 20% down, the loan would be $790,000. At 7.17%, principal and interest would run about $5,346 per month. At 6.29%, that same loan would run about $4,885. That’s roughly $460 a month on the same house, before taxes, insurance, HOA dues or loan costs. Your actual rate will depend on your loan and lender.
The recent improvement helps. I’m watching whether it brings people back for a second showing and, more importantly, gets more offers written. Buyers still have to make the payment work at the rate they can get today. Any opportunity to refinance later is a separate decision.
Are people still moving to Tennessee?
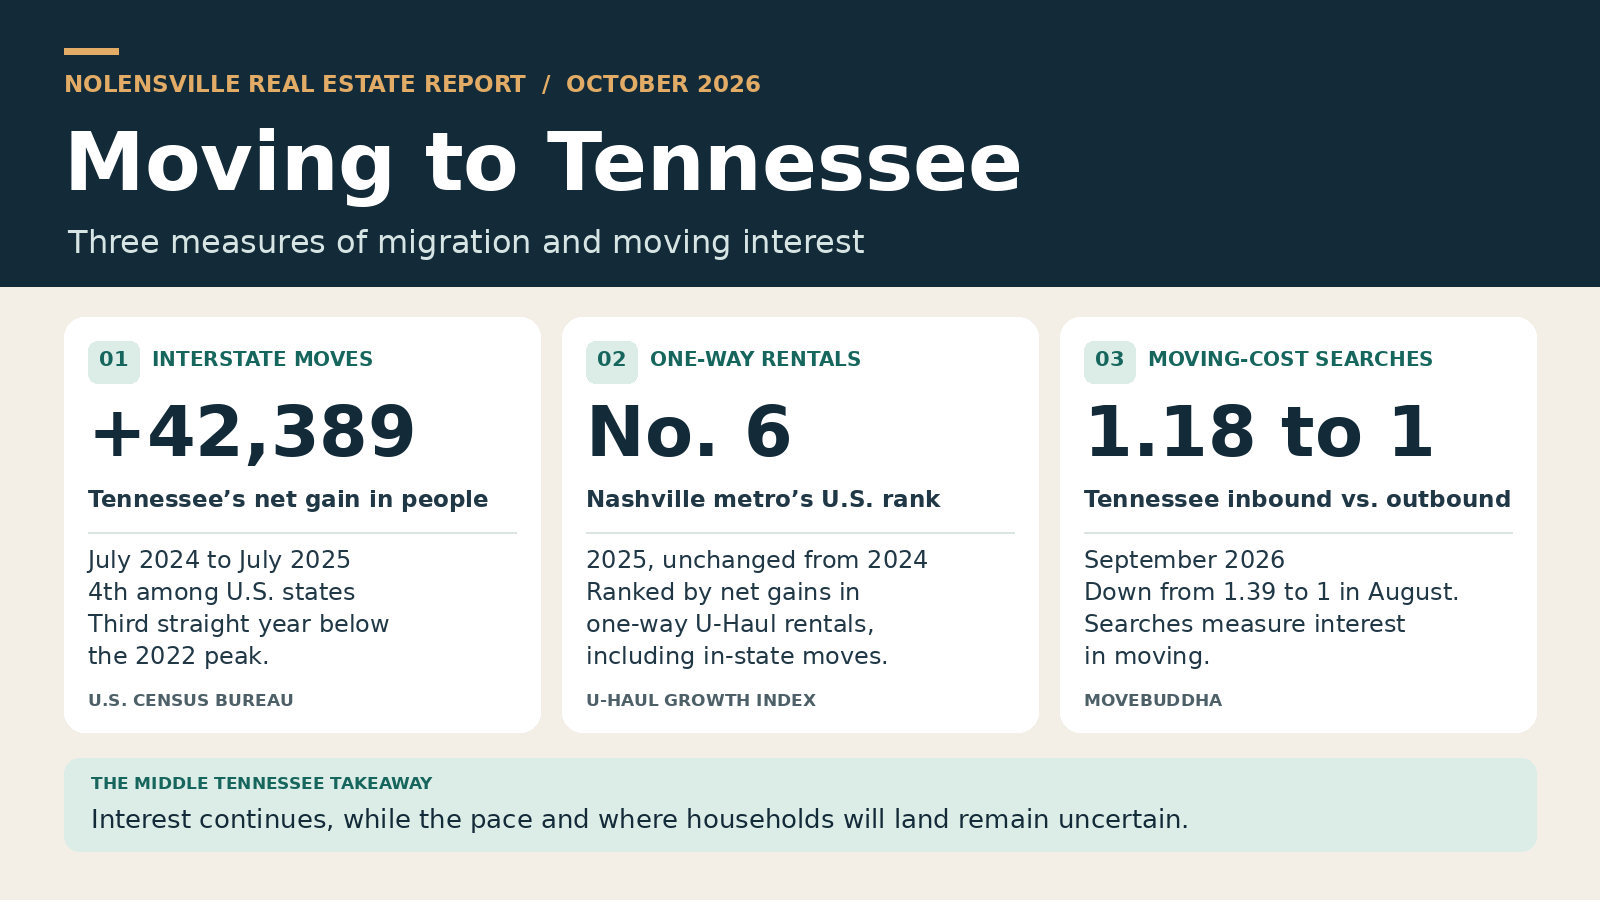
The latest Census population estimates put Tennessee’s net gain from other states at 42,389 people from July 2024 to July 2025, fourth in the country behind North Carolina, Texas and South Carolina. It was also the third straight year that net domestic migration came in below Tennessee’s 2022 peak. U-Haul ranked the Nashville metro sixth for net gains in its one-way rentals in 2025, the same rank as in 2024. That includes moves within a state.
There’s a newer read on interest, too. In September 2026, moveBuddha logged 1.18 searches for moves into Tennessee for every search for a move out, down from 1.39 in August. Those are moving-cost searches. The Census figures tell us about people who moved, and the search data give us a more recent, narrower look at people considering it. I take both as reasons to expect continued interest in Middle Tennessee, with less certainty about the pace and where those households will land.
What I expect in Nolensville in November and December
Over the last five years, June was our busiest closing month, averaging just over 43 sales. January and February were the quietest, averaging about 24 each. November averaged about 29 closings and December about 33, but those December numbers include 42 closings in 2021 and 56 in 2022. Over the last three years, the averages were 24 in November and 22 in December. In 2025, we finished with 27 and 19, respectively. That more recent stretch is where I’d start.
November: My working range is 20 to 27 closings. October averaged 52 homes already under contract, which gives November some business to work with. That was down from 68 in September, and the listing-level snapshot included 32 new or to-be-built homes among the 52 listings carrying an under-contract status. Some of those have longer timelines. With just 18 new October contracts, I’d plan around a month that looks a lot more like October than September.
December: My working range is 17 to 24 closings. We should have a better read once we see how many November contracts get signed before Thanksgiving. If mortgage rates ease toward or below 7% and more of those buyers write offers, I’d look toward the top of the range. If rates turn higher again or new contracts remain around October’s level, I’d look toward the bottom. A handful of builder closings moving across the calendar can change the result in a market this size.
With 117 average active listings and 5.74 months of supply in October, I expect buyers to have room to compare homes through year-end. Some sellers will take their homes off the market for the holidays, which can thin out the selection in a particular neighborhood even if overall demand is slow. For sellers who need to move this winter, I’d price to the sales and competition we can see now and agree on when we’ll review the response. For buyers, this is a good time to do the math and look closely at homes you might have passed over earlier in the year.
 If you are thinking about buying or selling a home in Nolensville, I would be happy to help you understand what these numbers mean for your specific situation.
Give me a call or text at 615-500-6393, or email me at flint@theguidehome.com.
Interested in up-to-date Nolensville TN real estate sales figures? I can email you an hourly updated look at Nolensville real estate activity, including what has gone pending, price-reduced, and withdrawn. Just send me your name and preferred email address.