

by Flint Adam, Nolensville resident & REALTOR®
UPDATED Monday, May 7, 2020 WITH FINAL WILLIAMSON COUNTY STATS
*Note: The information below cites Williamson County sales data for Nolensville, Tennessee. There is, of course, a small percentage of Nolensville homes that exist in Davidson and Rutherford counties, but for continuity in my blogging I reference only Williamson County statistics.
 April 2020 had a big question mark on it. Tennessee, and much of the United States, began shutting down in March as the coronavirus, Covid-19, began spreading across the nation. While the real estate industry was deemed an “essential service” and kept open, the reality is that showings slowed, inventory dipped, and Nolensville REALTORS® were left wondering how April would shape up.
Well, now we know. Despite unprecedented circumstances, Nolensville home sales remained roughly flat year-over-year. I would call that a huge win.
April 2020 sales stats vs. April 2019:
*note: my Nolensville stats are revised as of 5/7/2020 and include some numbers the Williamson County Association of REALTORS did not have available when they compiled their report, discussed further down.
- 36 Nolensville homes sold… down from 37 (-2.7%)
- The average sales price was $596,120… up from $519,372 (+14.78%)
- The average days on market was 32… up from 23 (+39.13%)
- The list price to sales price ratio was 99.47%… up from 98.68% (+0.79%)
- 21 of the 36 homes (58%) sold were new construction
- The highest price sale was 2662 Sanford Rd. for $904,328.
- The lowest price sale was 822 Cottage House Ln. for $330,580
Nolensville Foot Traffic:
I started watching this data last month as it helps us understand in real-time what’s happening in the marketplace. ShowingTime is a company that manages showing-requests for real estate brokerages in Greater Nashville. It’s not universally used, but is a good indicator of what foot traffic looks like. It does not typically capture new construction showings.
ShowingTime confirmed 32 total showings last month in the Nolensville (Williamson Co.) marketplace.
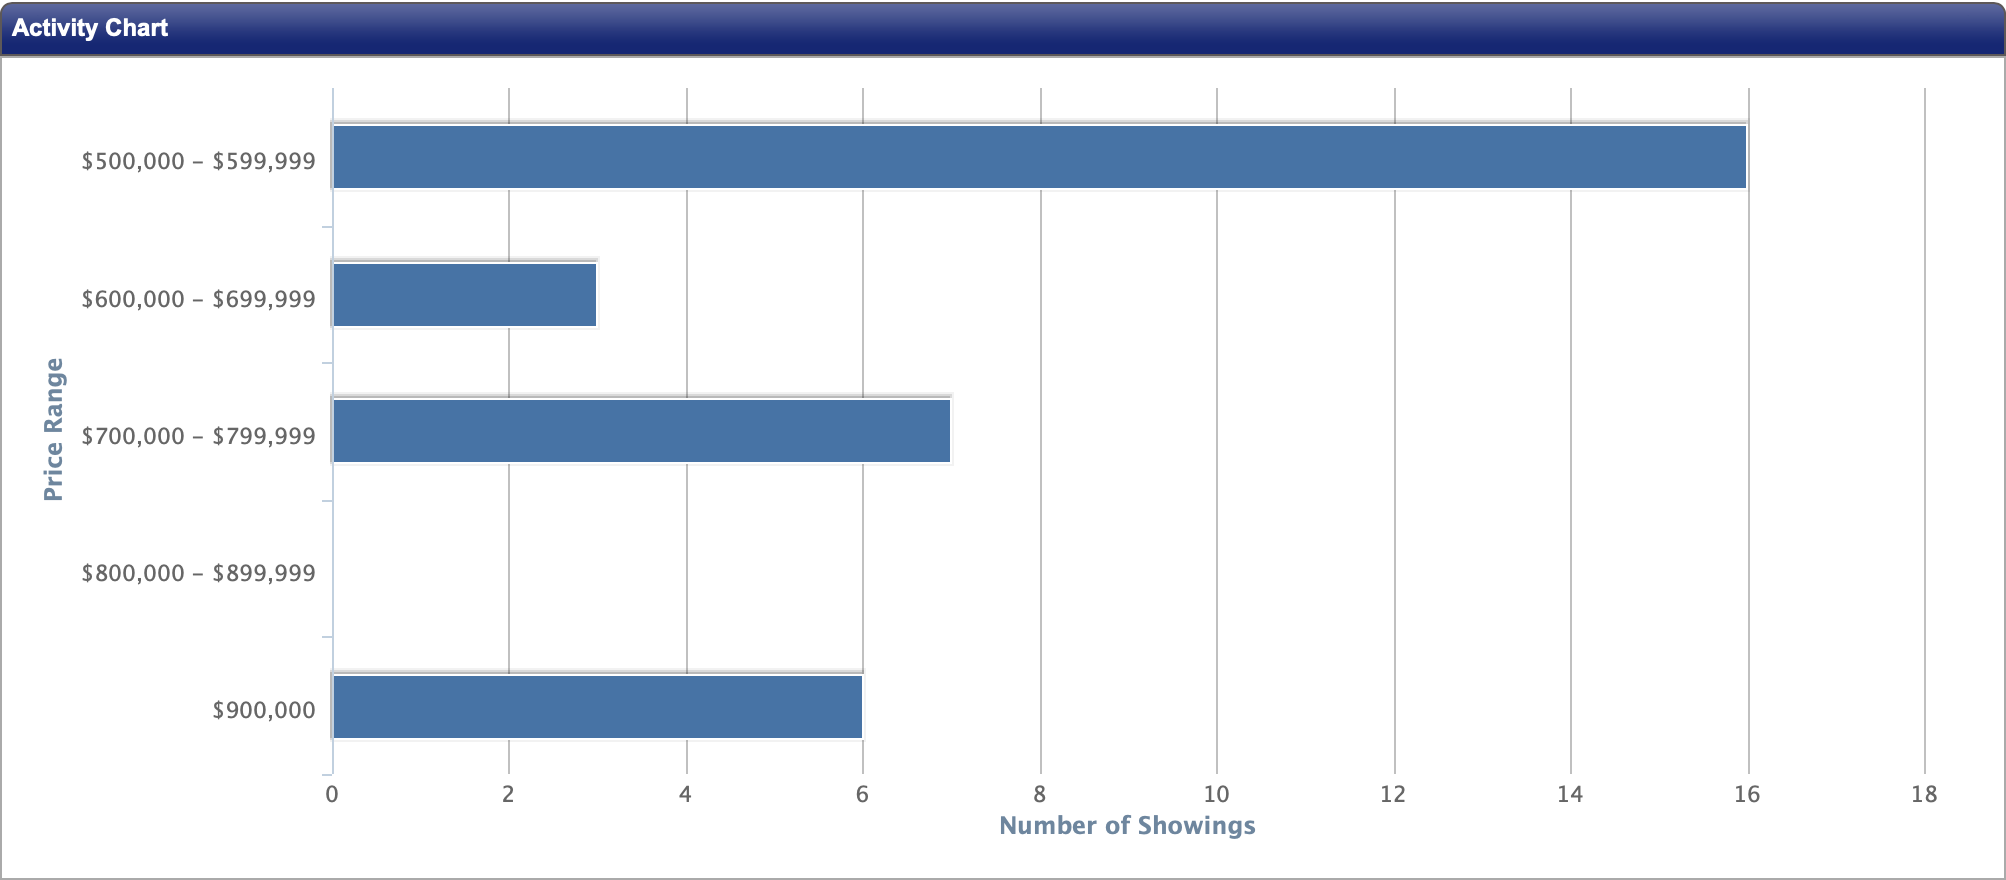
April 2020 showings confirmed by ShowingTime for Nolensville, area-10 (Williamson County).
That’s down significantly from the year before when 458 showings happened during the month of April. That’s a 93% drop year-over-year. It remains to be seen what, if any, impact that statistic will have on May and June 2020 closings.
The good news is that in my own business, and among other agents I’ve spoken with, the “quality” of showings is high even if overall showings are down. The buyers out looking right now are very motivated and making good offers.
The Takeaway…
Despite the lockdown, April 2020 real estate closings remained on par with last year, home prices were up, and offers were even stronger than during the same time last year.
We are fortunate to live in one of the country’s best real estate and job markets. We’re somewhat insulated from the worst of what’s happening out there. Of course, keep tuning in for my blogs as I’ll be keeping a pulse on activity in our community and let you know if I see anything concerning heading our way.
Related Blog Posts…
If you haven’t read my two most recent blog posts, take a few minutes to check them out. They both speak directly to how Nolensville real estate has been affected by the coronavirus, Covid-19.
- The Impact of Coronavirus on Nolensville Real Estate
- Nolensville Real Estate: Best First Quarter Sales Ever
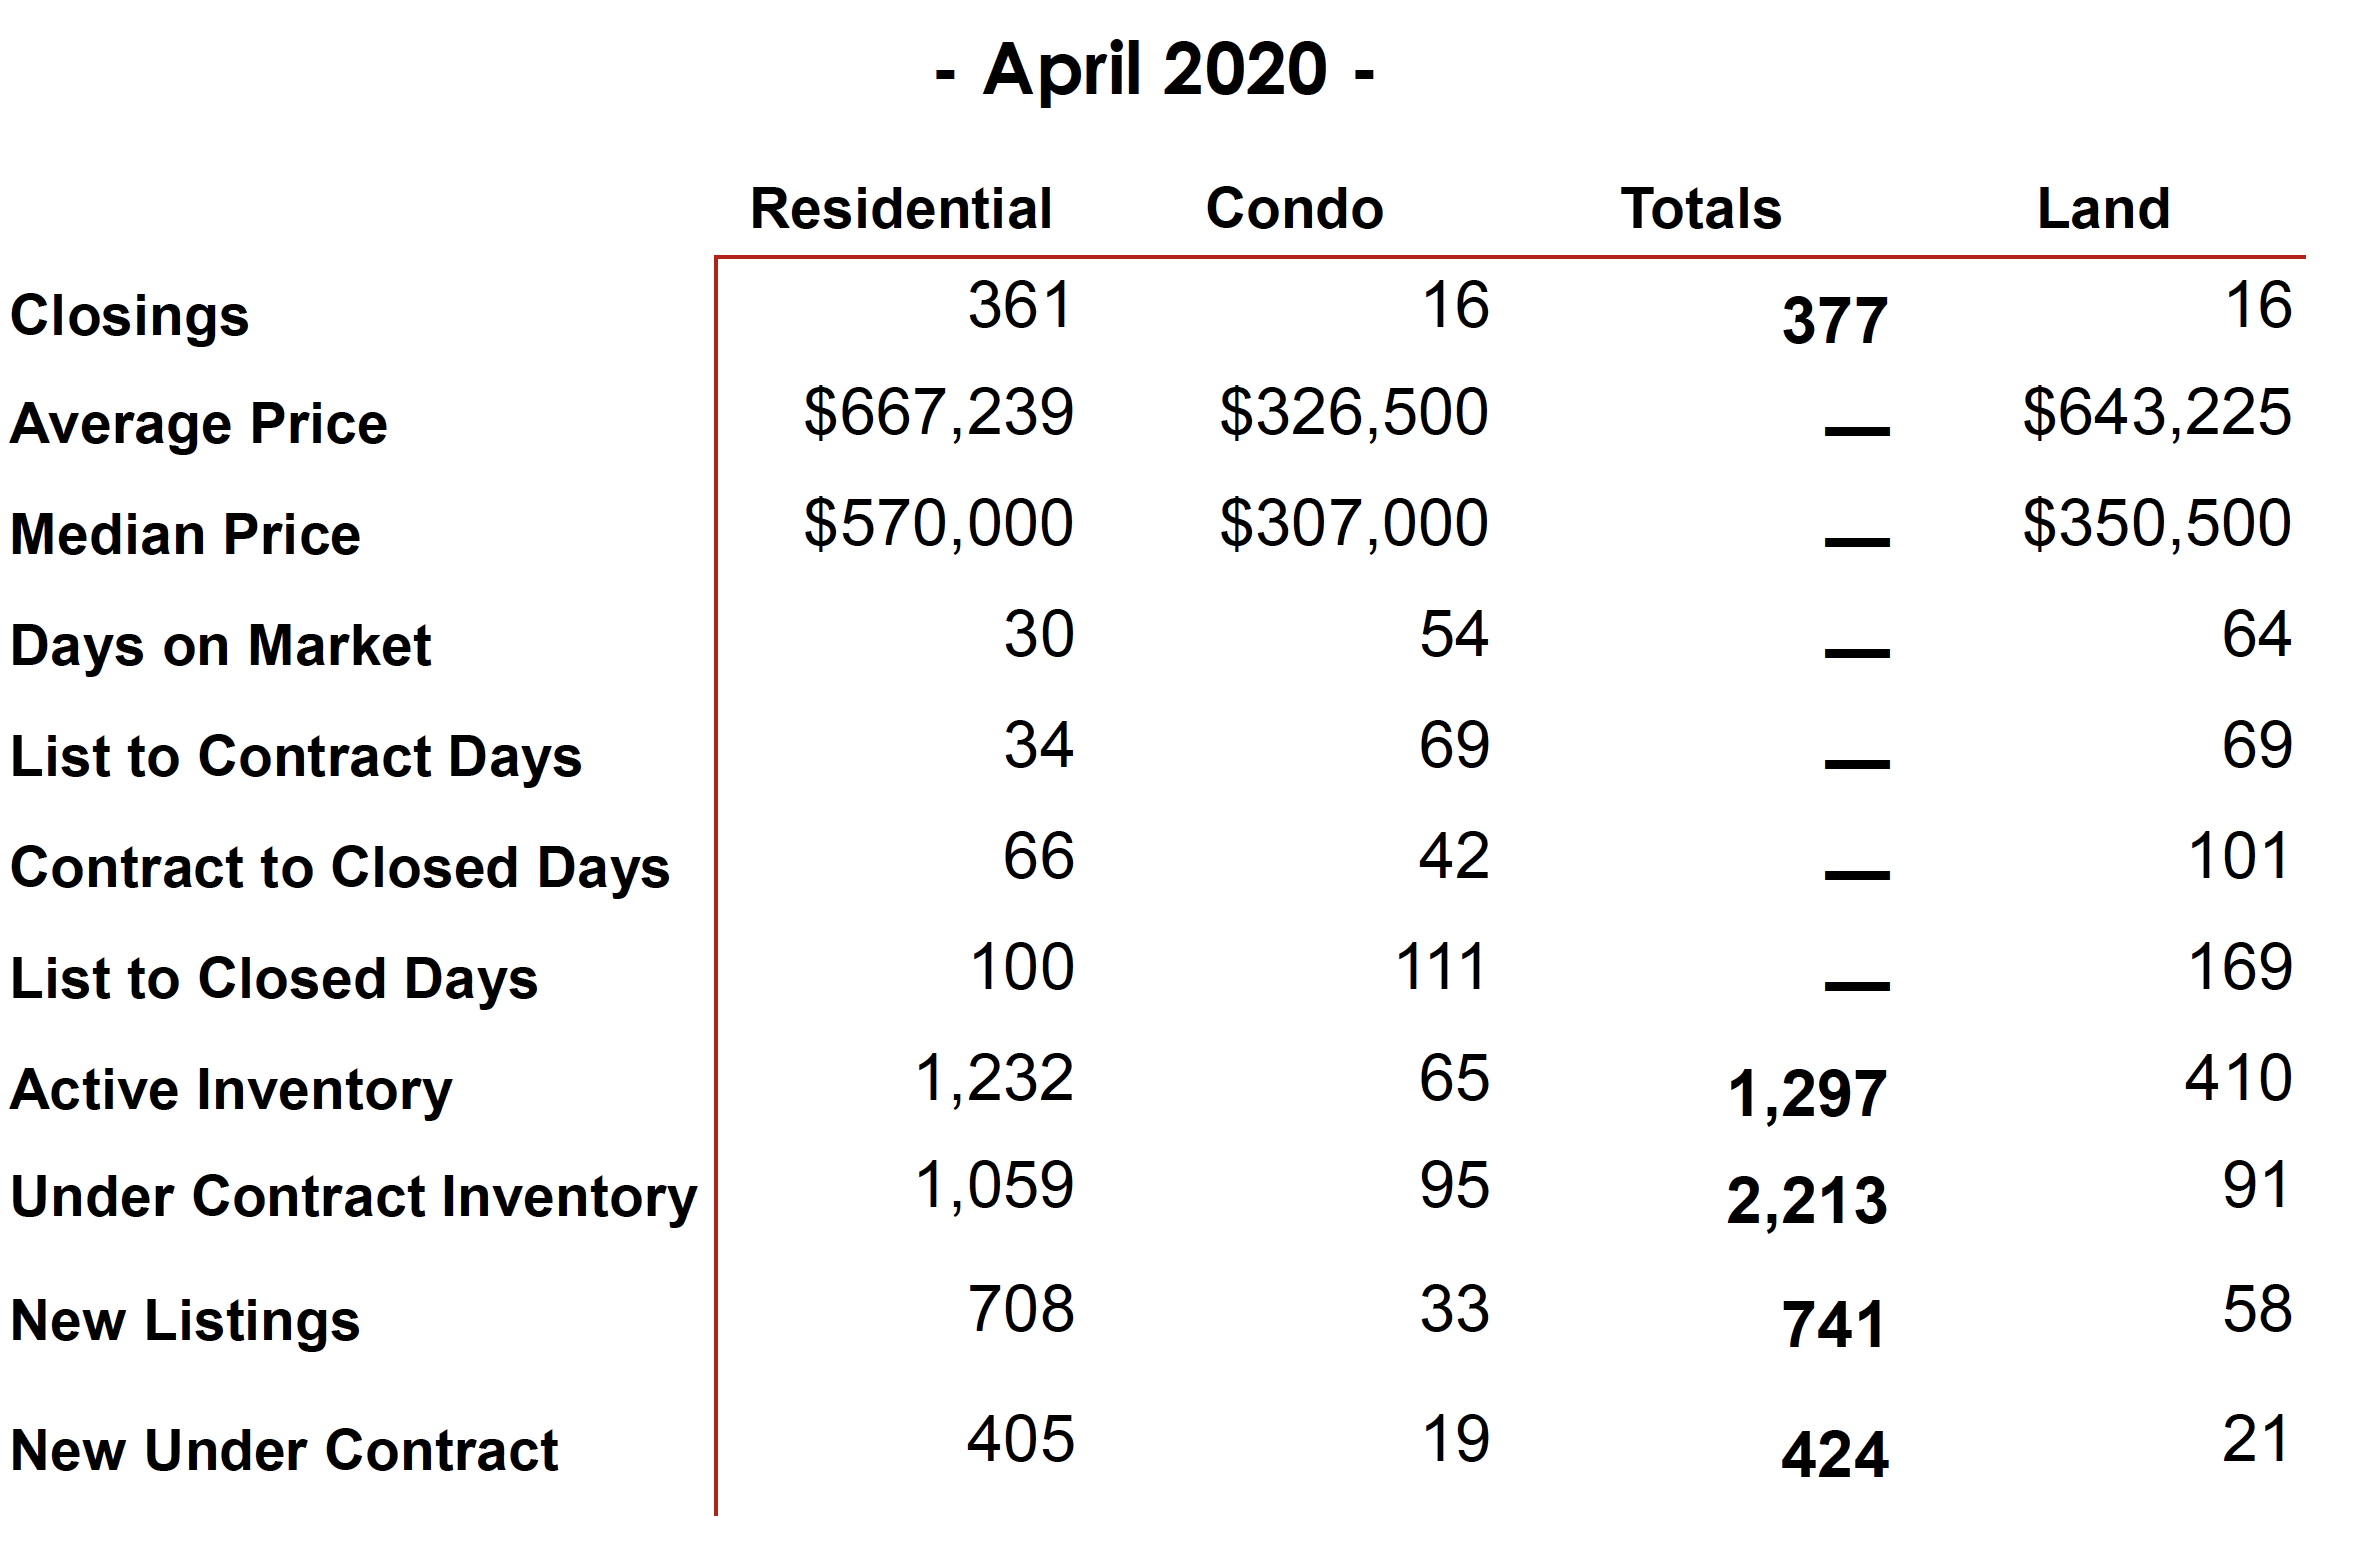
Williamson County Home Sales Stats (NEW INFO 5/7/2020)
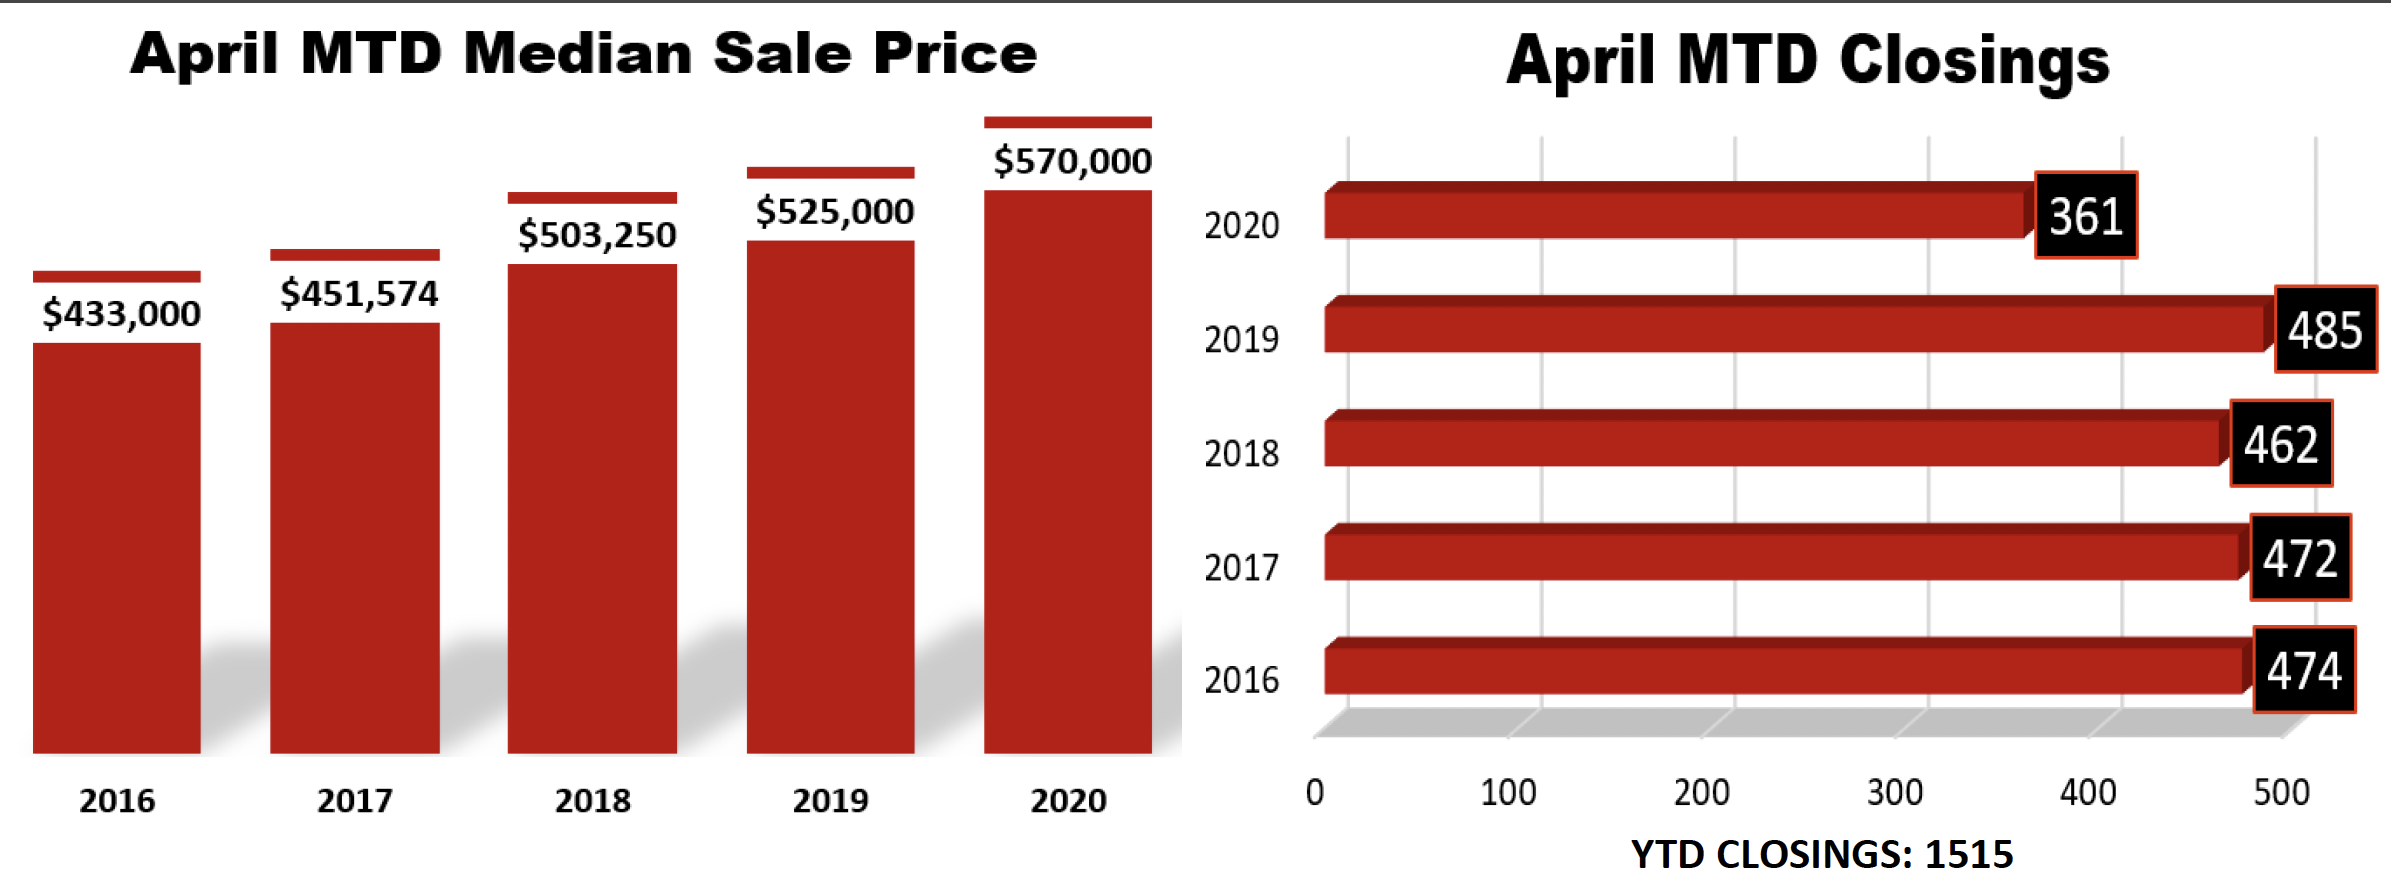
Year-over-year April home sales in Williamson County declined 22%… dropping from 485 sales in 2019 to 377 in 2020 (WCAR’s graphic, below, has a typo on that figure. They forgot to include condos/townhomes).
Of course, there were remarkable circumstances at play with social-distancing and lockdowns. Inventory was also down 14% from April 2019 as some home sellers opted to ride the sidelines while the pandemic played out.
The median sales price of a Williamson County home jumped, though, from $525,000 in April 2019 to $570,000 last month.
Other interesting tid-bits…
- Days-on-market for single family homes dropped from 38 to 30 days.
- New listings dropped 28% year-over-year… with 708 in April 2020 compared to 979 the year before.
- Newly under contract properties dropped 36%… with 405 in April 2020 compared to 631 in April 2019.
This means our overall inventory will remain down… but with fewer buyers/contracts in motion right now, I expect things will remain pretty balanced. Prices should remain level and days on market, efficient.
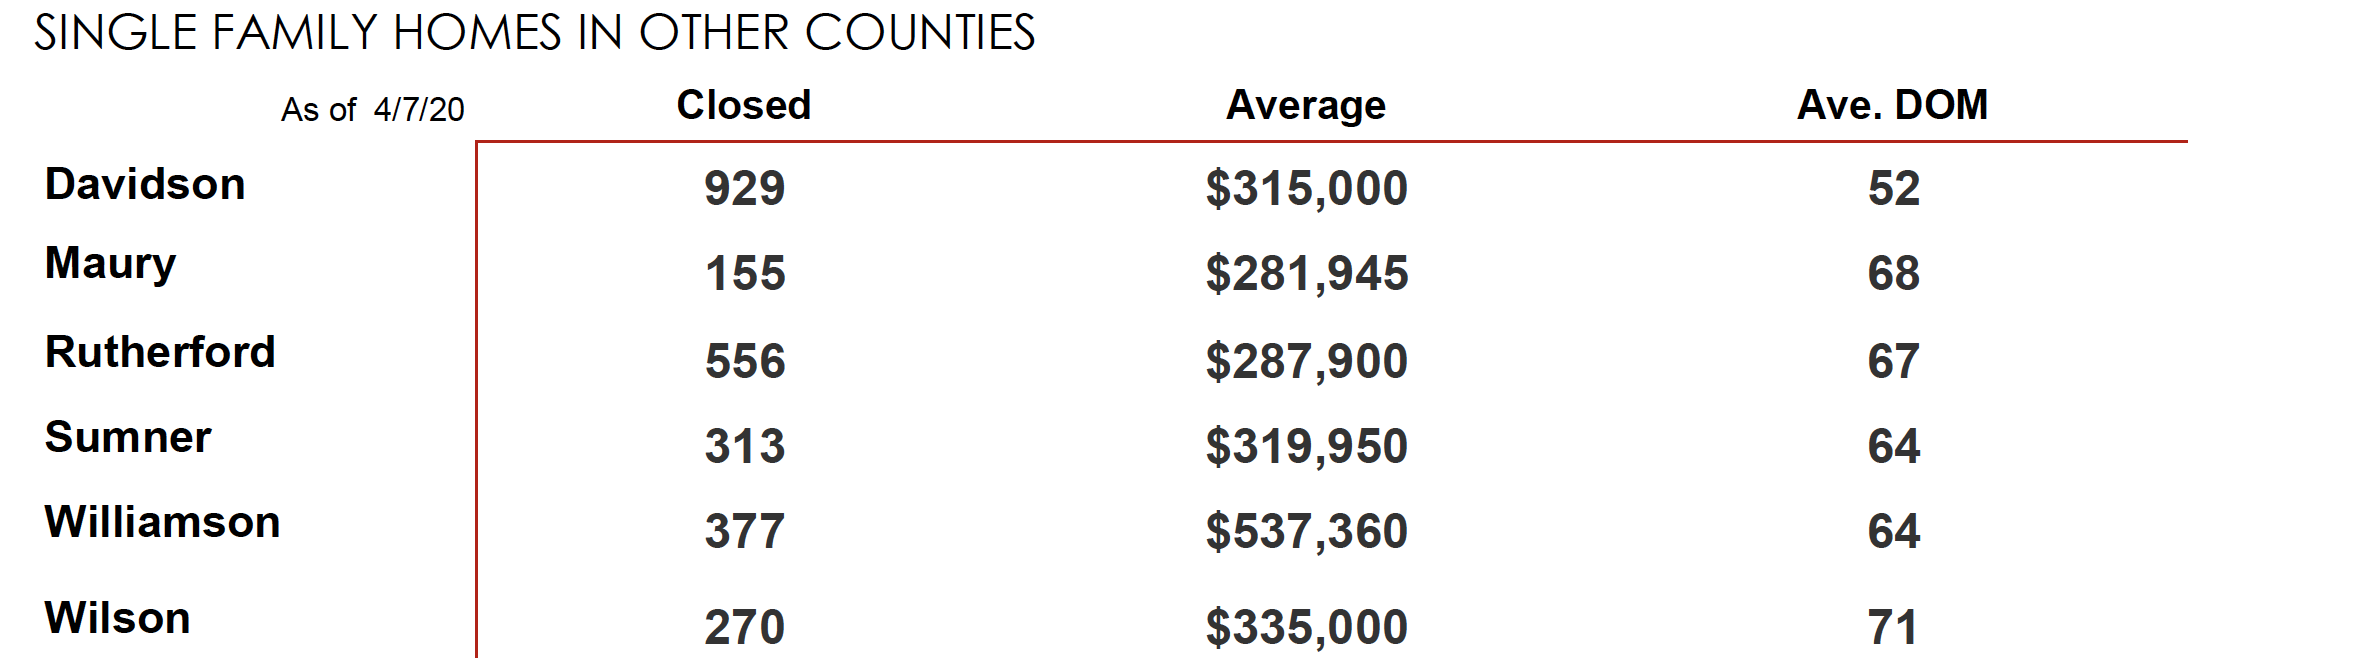
Franklin dwarfed the rest of the marketplace with 149 homes closed. The next most active cities were Brentwood and Spring Hill with 43 closings each.
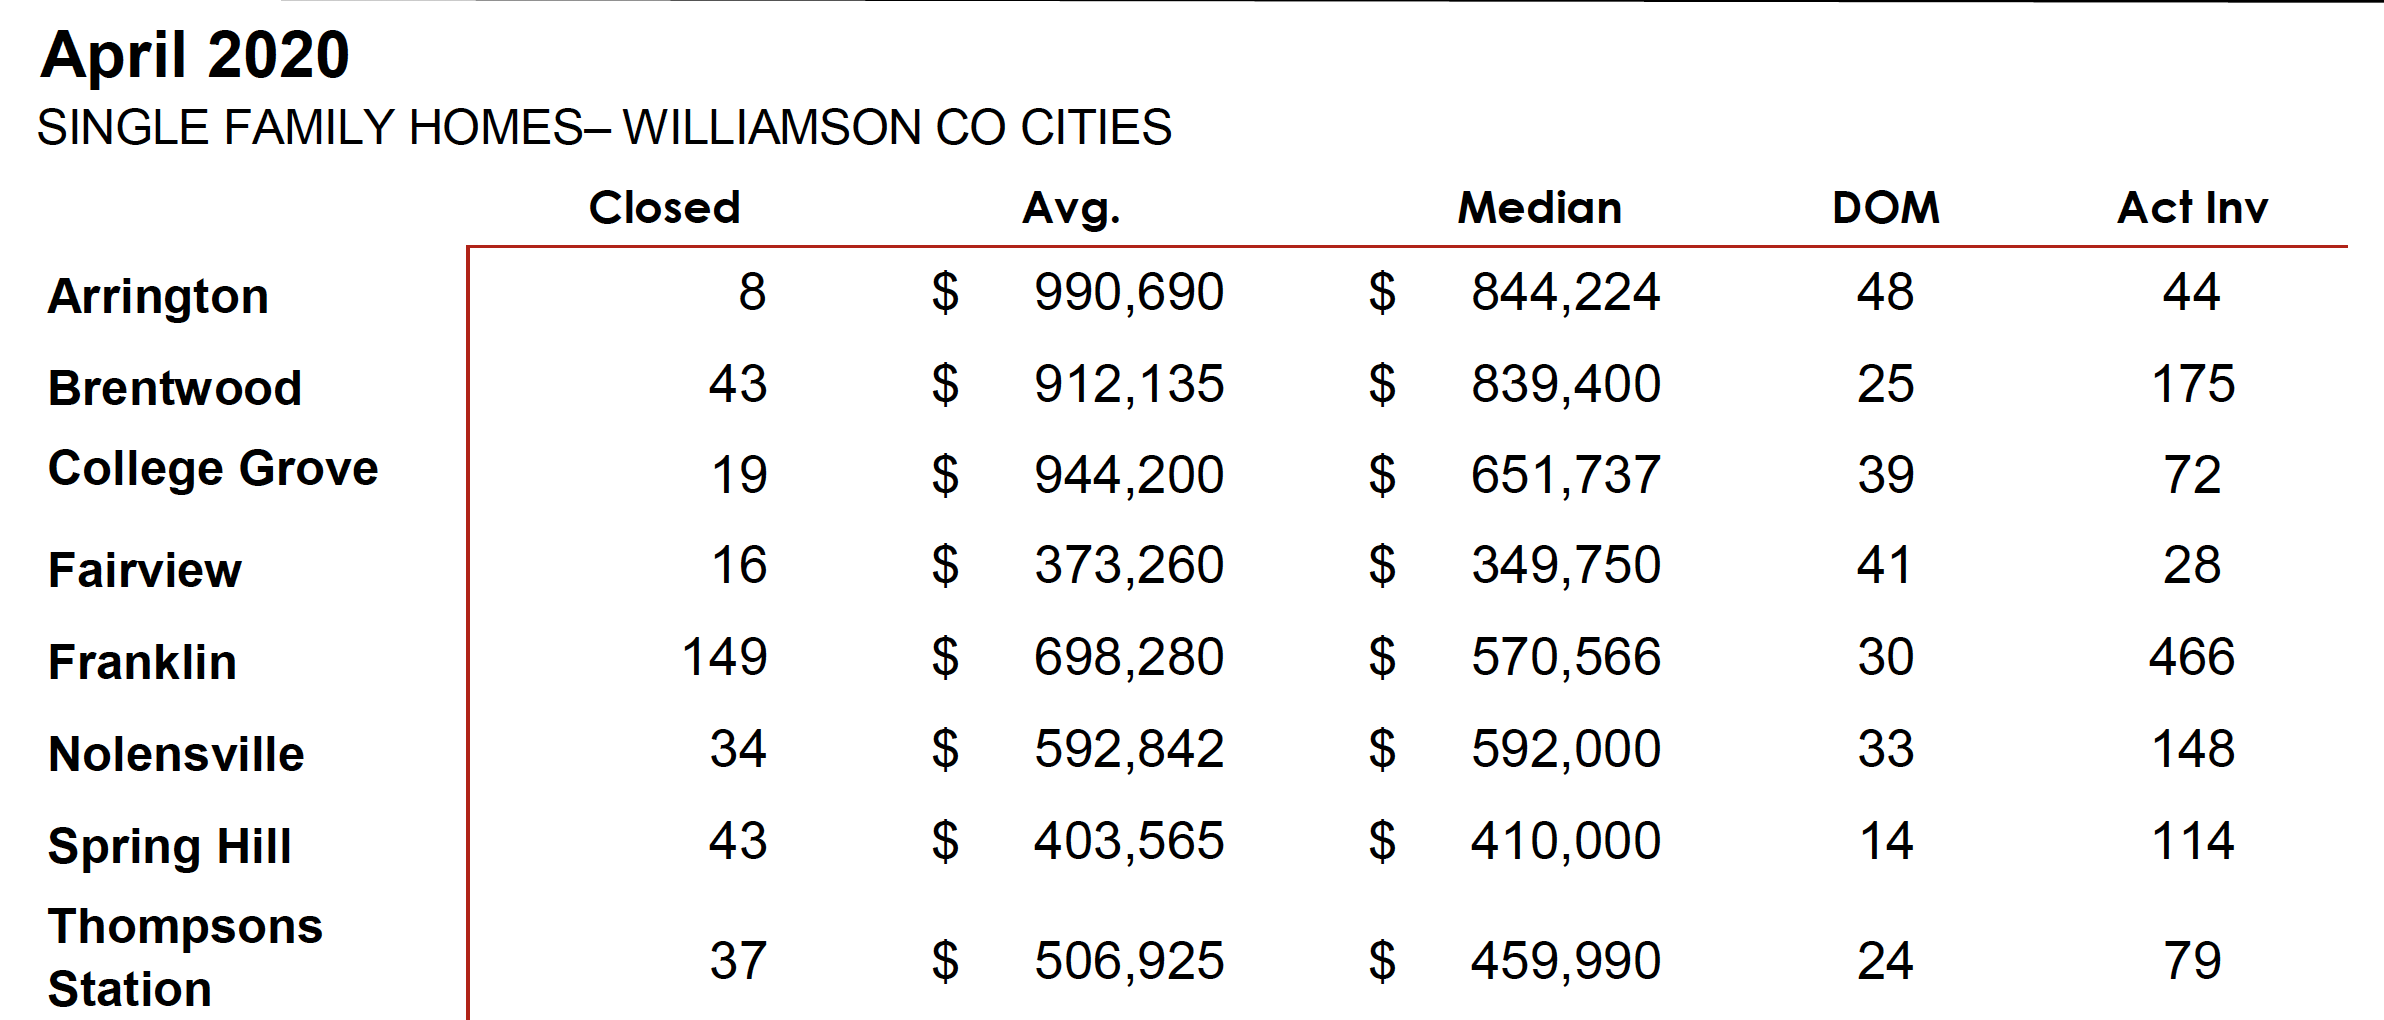
Finally, Williamson County maintained the highest average home sale price by $200,000 over second-place Wilson County. Davidson County homes, meanwhile, moved the fastest with an average 52 days on market.
I am available to answer questions and offer perspective to anyone who interested. There is never an obligation to work with me, I am here to serve my community. Call me at (615) 500-6393.
Interested in up to date Nolensville TN real estate sales figures? I’ll email you an HOURLY UPDATED look at Nolensville real estate activity including what has gone pending, price-reduced, and withdrawn. Just shoot me an email with your name and preferred email address to flint@theguidehome.com
Mortgage Rates…
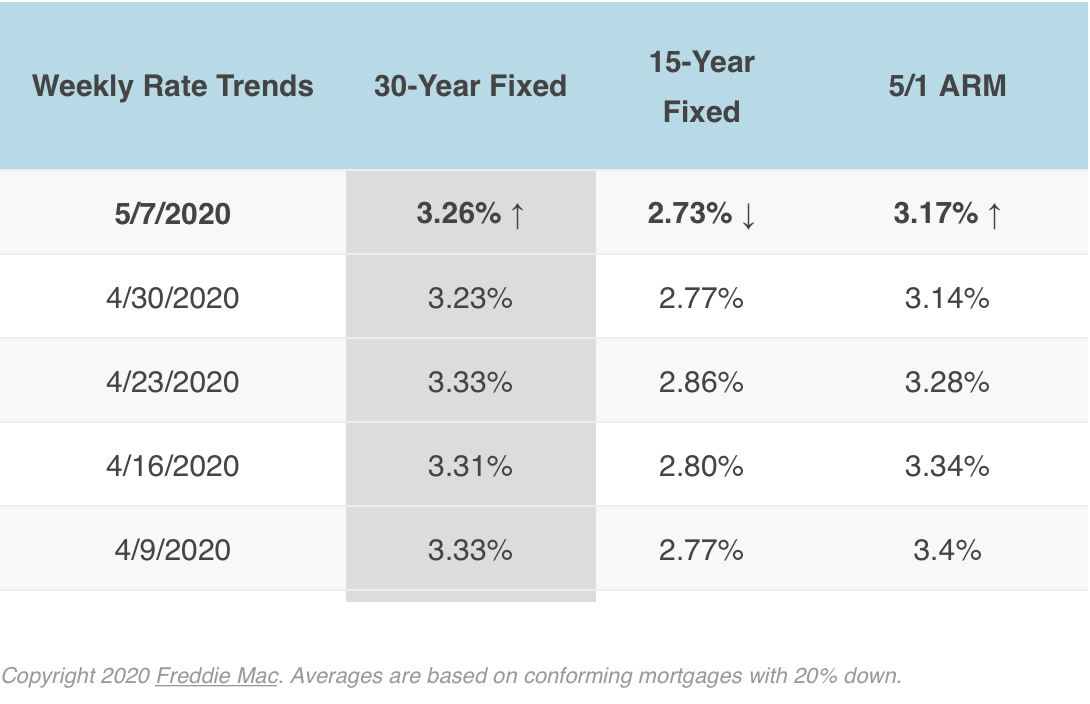
From My Mortgage Insider.com: “
Mortgage application volume was largely unchanged this week, as reported by Mortgage Bankers Association. “Despite lower rates, refinance applications dropped, as many lenders are offering higher rates for refinances than for purchase loans, and others are suspending the availability of cash-out refinance loans because of their inability to sell them to Fannie Mae and Freddie Mac,” said Mike Fratantoni, MBA’s Senior Vice President and Chief Economist.
The interest rates reported below are from a weekly survey of 100+ lenders by Freddie Mac PMMS. These average rates are intended to give you a snapshot of overall market trends and may not reflect specific rates available for you.”
I’m a Nolensville TN resident… I’m a Nolensville TN Realtor®… and I always offer a complimentary, no commitment, no pressure Comparative Market Analysis for my neighbors. Please let me know how I may assist you in the sale or purchase of a Nolensville property.