
by Flint Adam, Nolensville resident & Realtor®
UPDATED Monday, April 13, 2020 WITH FINAL STATS FROM THE Williamson County Association of REALTORS.
*Note: The information below cites Williamson County sales data for Nolensville, Tennessee. There is, of course, a small percentage of Nolensville homes that exist in Davidson and Rutherford counties, but for continuity in my blogging I reference only Williamson County statistics.
Yes, at the time of this writing there is a world-wide pandemic happening and the effects it will have on real estate aren’t really known yet. I’ll touch on this subject in a future blog, but for now let’s focus on the positive.
Nolensville residential real estate just had its best first quarter… ever!
Both locally, and across much of the nation, 2020 home sales began with a bang. Here in town monthly records were either set or tied through the first three months of the year:
- January – 54 sales (prior record was 43 in 2017)
- February – 38 sales (tied record set in 2018)
- March – 61 sales (prior record was 56 in 2019)
First quarter Nolensville home sales grew 17% year-over-year, with 153 total closings. Last year was the previous record-holder for Q1 sales when 131 homes closed.
Other Q1 numbers of note:
- The average sales price in Nolensville grew 4% year-over-year… from $560,236 to $582,954.
- Days on market for resales dropped an astounding 32%… from 44 to 30 days.
- New construction sales made up 63% of all Q1 closings… up slightly from 62% in Q1 2019.
March 2020 sales, in particular, were impressive:
- Total Nolensville homes sales grew 9% year-over-year.
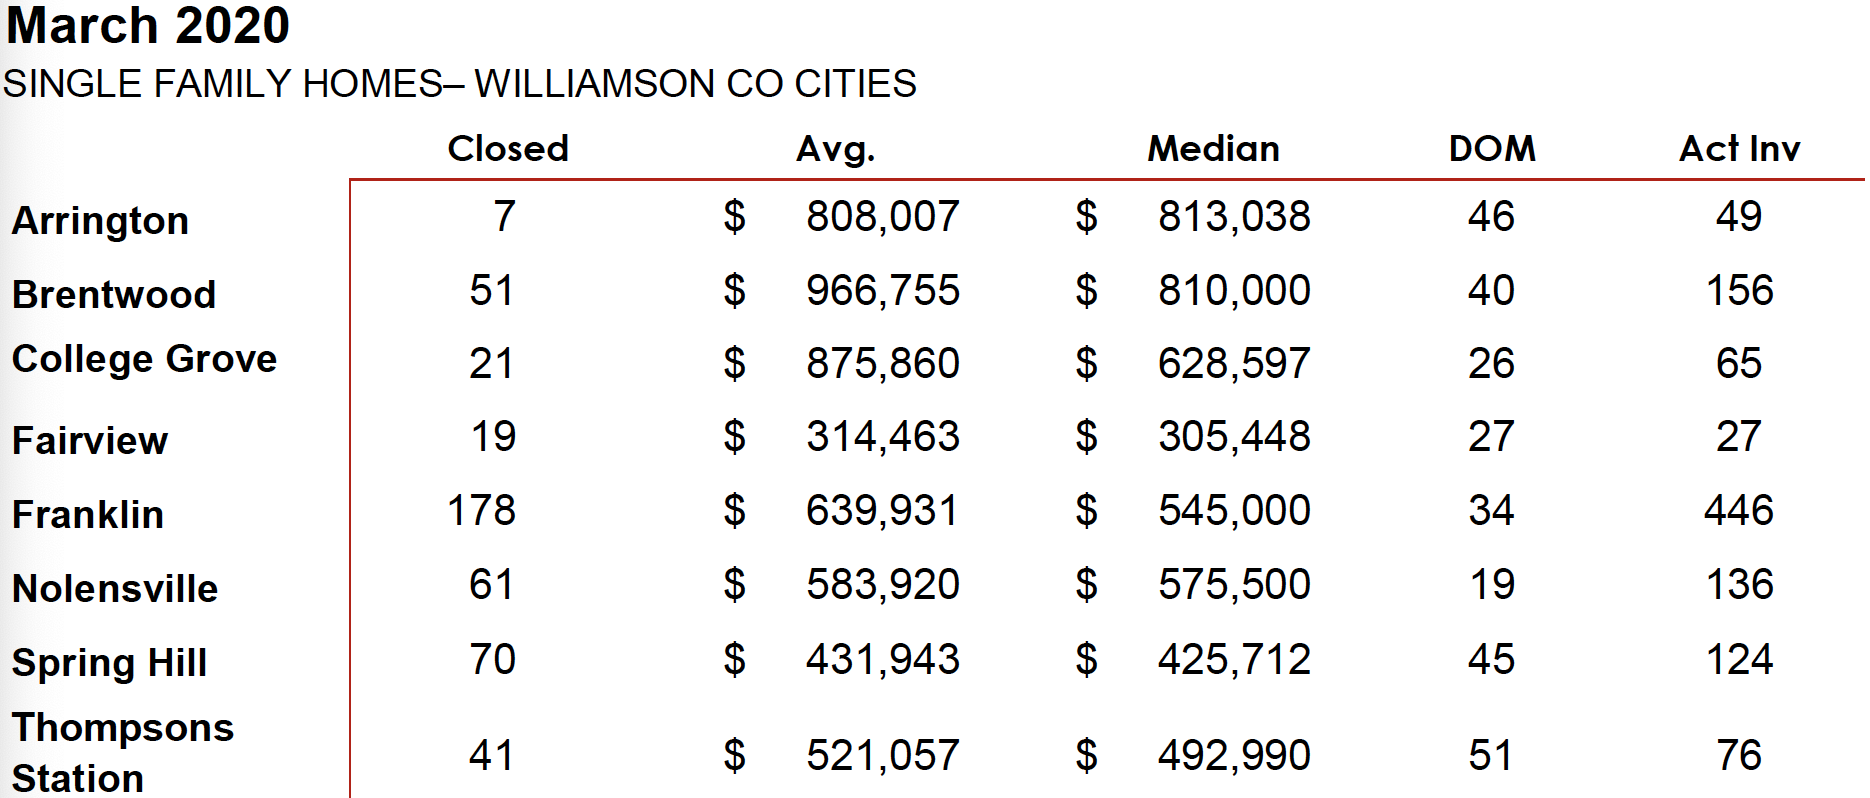
- The average sales price gained 5.5% year-over-year… up to $583,920 from $553,497.
- The highest price sale was 416 Oldenburg Rd. for $939,900.
- The lowest price sale was 809 Cottage House Ln. for $322,900
All of the these record-setting numbers were happening in what is typically the slowest quarter of the year. The stage was set for an absolutely MASSIVE 2020. But then coronavirus happened, (NEW!) and perhaps what may be a harbinger for the months ahead, March inventory dropped 38% year-over-year to 136 homes from 219 in March 2019.
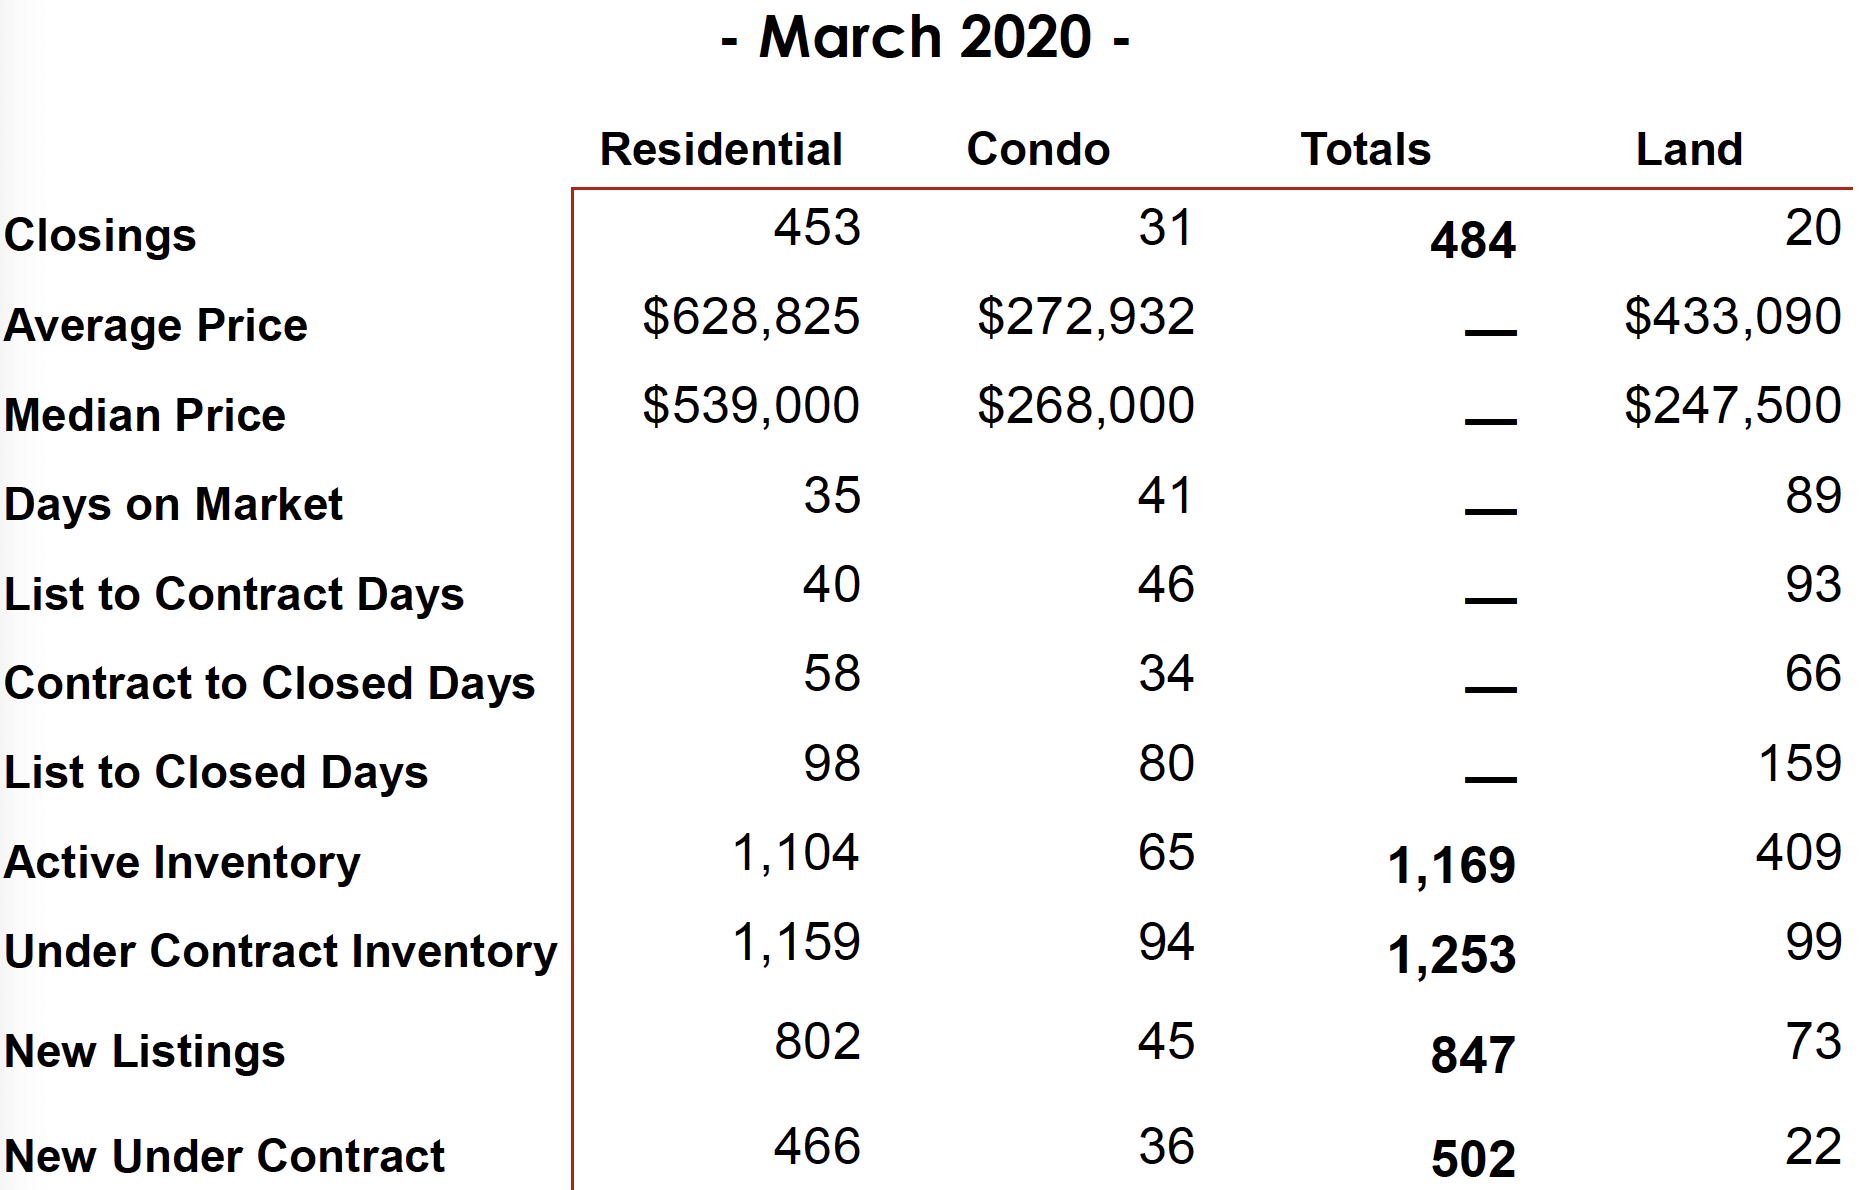
Williamson County Home Sales Stats (New Info on 4/13/20)
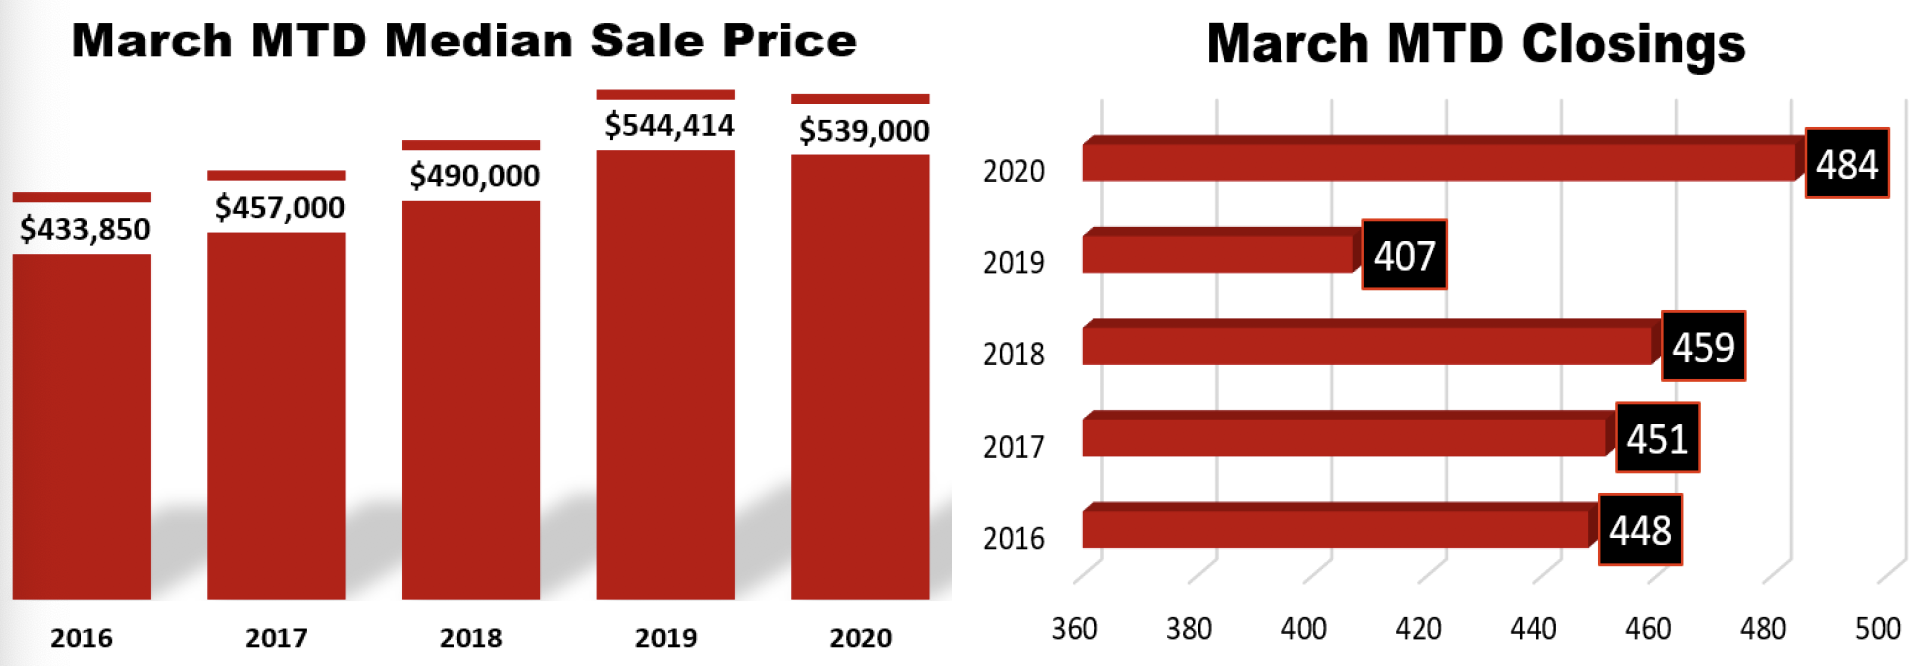
Year-over-year March home sales in Williamson County grew 19%, rising from 407 sales in 2019 to 484 in 2020. The median sales price of a Williamson County home dipped slightly, though, for the first time in at least the past five years.
Other interesting tid-bits…
- Days on market remained the same year-over-year at 35 days for single-family homes.
- New listings dropped 17% year-over-year… with 802 in March 2020 compared to 970 the year before.
- Newly under contract properties dropped 19%… with 466 in March 2020 compared to 579 in March 2019.
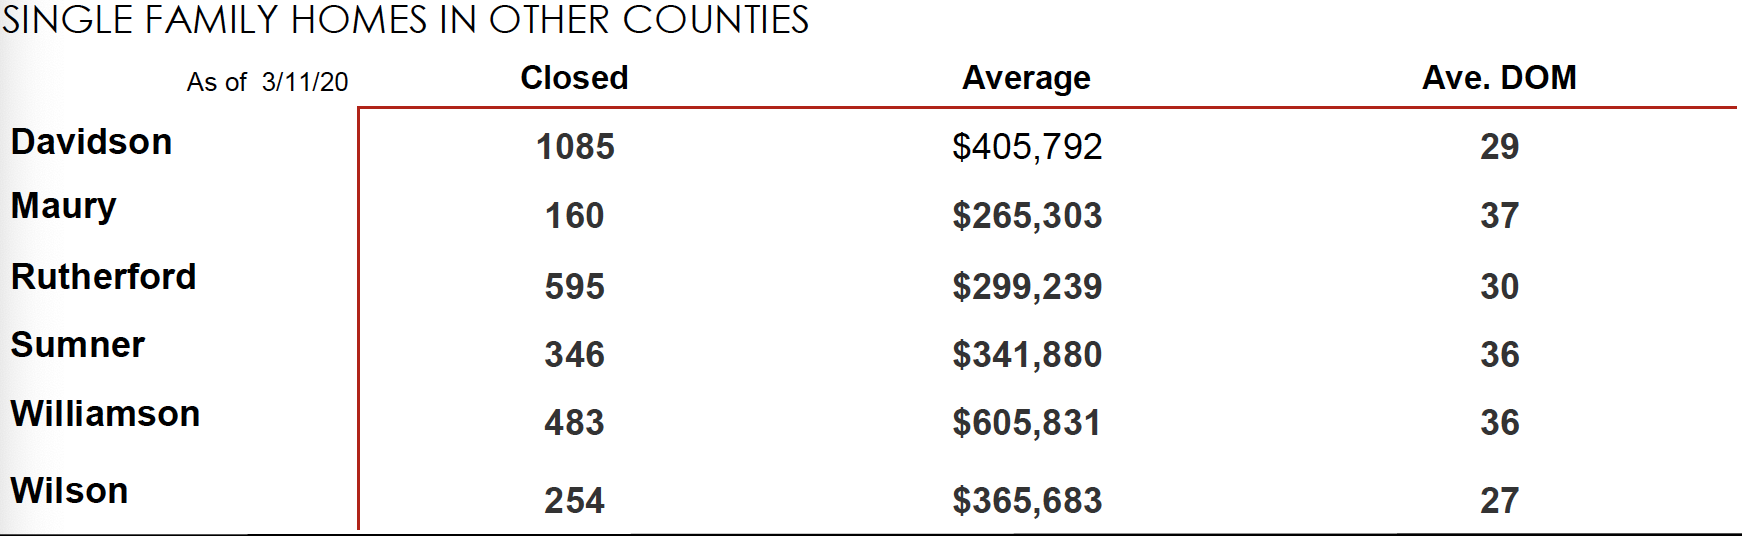
Franklin remained the most active spot for home sales in Williamson County, with Brentwood commanding the highest average sales price.
Finally, Williamson County maintained the highest average home sale price by $200,000 over second-place Davidson County.
Where Do We Go From Here?
I’ve been mulling this question ever since Covid-19 reached pandemic status a few weeks ago. While many business across the country have shut down due to social distancing, real estate is considered an “essential business” and remains active.
I had three new listings hit the market the past couple weeks, and while I can say overall foot traffic is likely down from where it should be, buyers remain out there and many are still looking at homes. I’ve seen them in gloves and face masks, but the serious ones aren’t riding the sidelines. All in all, I’ve been pleasantly surprised by showing activity.
If you’re considering selling here is some food for thought:
- If your home is priced correctly and marketed well, it will still sell
- Days on market may lengthen some, but at this point not as much as you may fear
- If you are overly worried about strangers walking through your home and possibly contaminating surfaces, it may be best to hold off on listing until this pandemic resolves. I, and many agents, are practicing safe-showing recommendations… but there’s no sense in making yourself sick with worry about your home being shown.
I am available to answer questions and offer perspective to anyone who interested. There is never an obligation to work with me, I am here to serve my community. Call me at (615) 500-6393.
Interested in up to date Nolensville TN real estate sales figures? I’ll email you an HOURLY UPDATED look at Nolensville real estate activity including what has gone pending, price-reduced, and withdrawn. Just shoot me an email with your name and preferred email address to flint@theguidehome.com
Mortgage Rates…
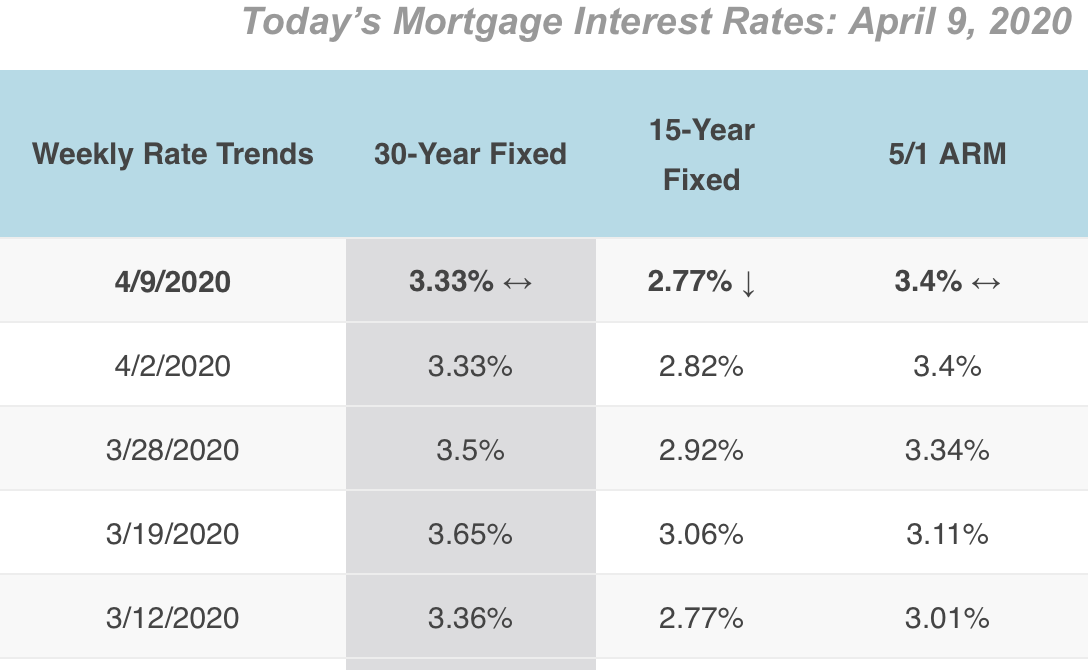
Click to expand image
From My Mortgage Insider.com: “Mortgage rates stayed mostly flat this week, as reported by Mortgage Bankers Association. “Mortgage applications fell last week, as economic weakness and the surge in unemployment continues to weigh heavily on the housing market,” said Joel Kan, MBA Associate Vice President of Economic and Industry Forecasting.
The interest rates reported below are from a weekly survey of 100+ lenders by Freddie Mac PMMS. These average rates are intended to give you a snapshot of overall market trends and may not reflect specific rates available for you.”
I’m a Nolensville TN resident… I’m a Nolensville TN Realtor®… and I always offer a complimentary, no commitment, no pressure Comparative Market Analysis for my neighbors. Please let me know how I may assist you in the sale or purchase of a Nolensville property.