

by Flint Adam, Nolensville resident & REALTOR®
I’m not going to mince words. The United States is now in a real estate recession. Here in Nolensville, we are, too. (Sort of.)
This month’s blog will cover the transition from a piping hot market in early 2022… to the very different market we find ourselves in today. I will review monthly and yearly data, both local and national, and then offer insight on where we’re heading.
I expect the near-term to be challenging. That said, real estate sells every month of the year and in every type of market. Even during the worst market anyone can remember, (The Great Recession of 2008/2009), real estate still sold… it just looked different.
Real estate continues selling here in Nolensville, too! There is some positive October data to celebrate, and some deflating October data to ruminate on. I think the coming months could be more challenging than the past several, but we are fortunate to live in one of, if not THE best real estate market in the nation, and we remain better positioned to weather the storm than many other parts of the country.
My intent this month is to recap October’s numbers, educate you, prepare you for what’s ahead, discuss what is and isn’t working, and then remind you that the world will keep spinning and that we’ll make it through this.
First, Hold On To Your Butts…
Industry titan and real estate-lifer, Gary Keller, co-founder of Keller Williams, recently said that he expects this market to become the second-worst year ever for a drop-off in U.S. home sales, eclipsed only by the second year of the Great Recession. Back then, 1.5 million fewer homes sold than the year before. This go-around, Keller believes that 1.3 million fewer homes will sell.
Meanwhile, the massive iBuying operation, OpenDoor, lost almost $1 BILLION dollars in the third quarter, alone, due to the incredible number of houses they bought and then sold at substantial losses.
And Redfin’s CEO says home prices are falling faster right now than they did in 2006, when the housing crisis-led Great Recession was just getting underway. (They’re getting out of the iBuyer game, too, after suffering huge losses).
Meanwhile, other recent headlines have painted an ulcer-creating picture:
- Wells Fargo has reportedly seen a 90% drop in new mortgage applications year-over-year.
- Homebuilders say they’re on the edge of a steeper downturn as buyers pull back
- Moody’s: Home prices to crash 20% in Nashville
- Spring Hill, Nolensville residential building slows. Is it a sign of what’s next?
At fault are historically high home prices that peaked in early summer, mortgage interest rates that doubled within a year, the Fed’s aggressive rate-hiking policy that squarely aims at the housing and rental markets, a wavering economy, stubborn inflation, stock market correction, continued supply-chain disruption, election-year uncertainties, and swelling home inventory. Whew – call it a perfect storm!
Homebuilders Are Losing Confidence…
As new construction goes, so does much of the rest of the housing industry. There is even a trickle down effect into adjacent industries like loan origination, materials, transportation, and the labor markets, among others.
I want to point out the U.S. Traffic of Prospective Buyers in New Homes index, as reported by the National Association of Home Builders (NAHB). This seasonally adjusted index goes from 0 to 100 and measures the amount of foot traffic builders are reporting nationally. In records going back to 1985, this particular index peaked very recently – in November 2020 – at 77. It even began this year at a very strong 69 rating in January.
The drop since then has been incredible.
In October, the figure stood at 25. That is the lowest figure reported since June 2012 when it was all the way down at 23.
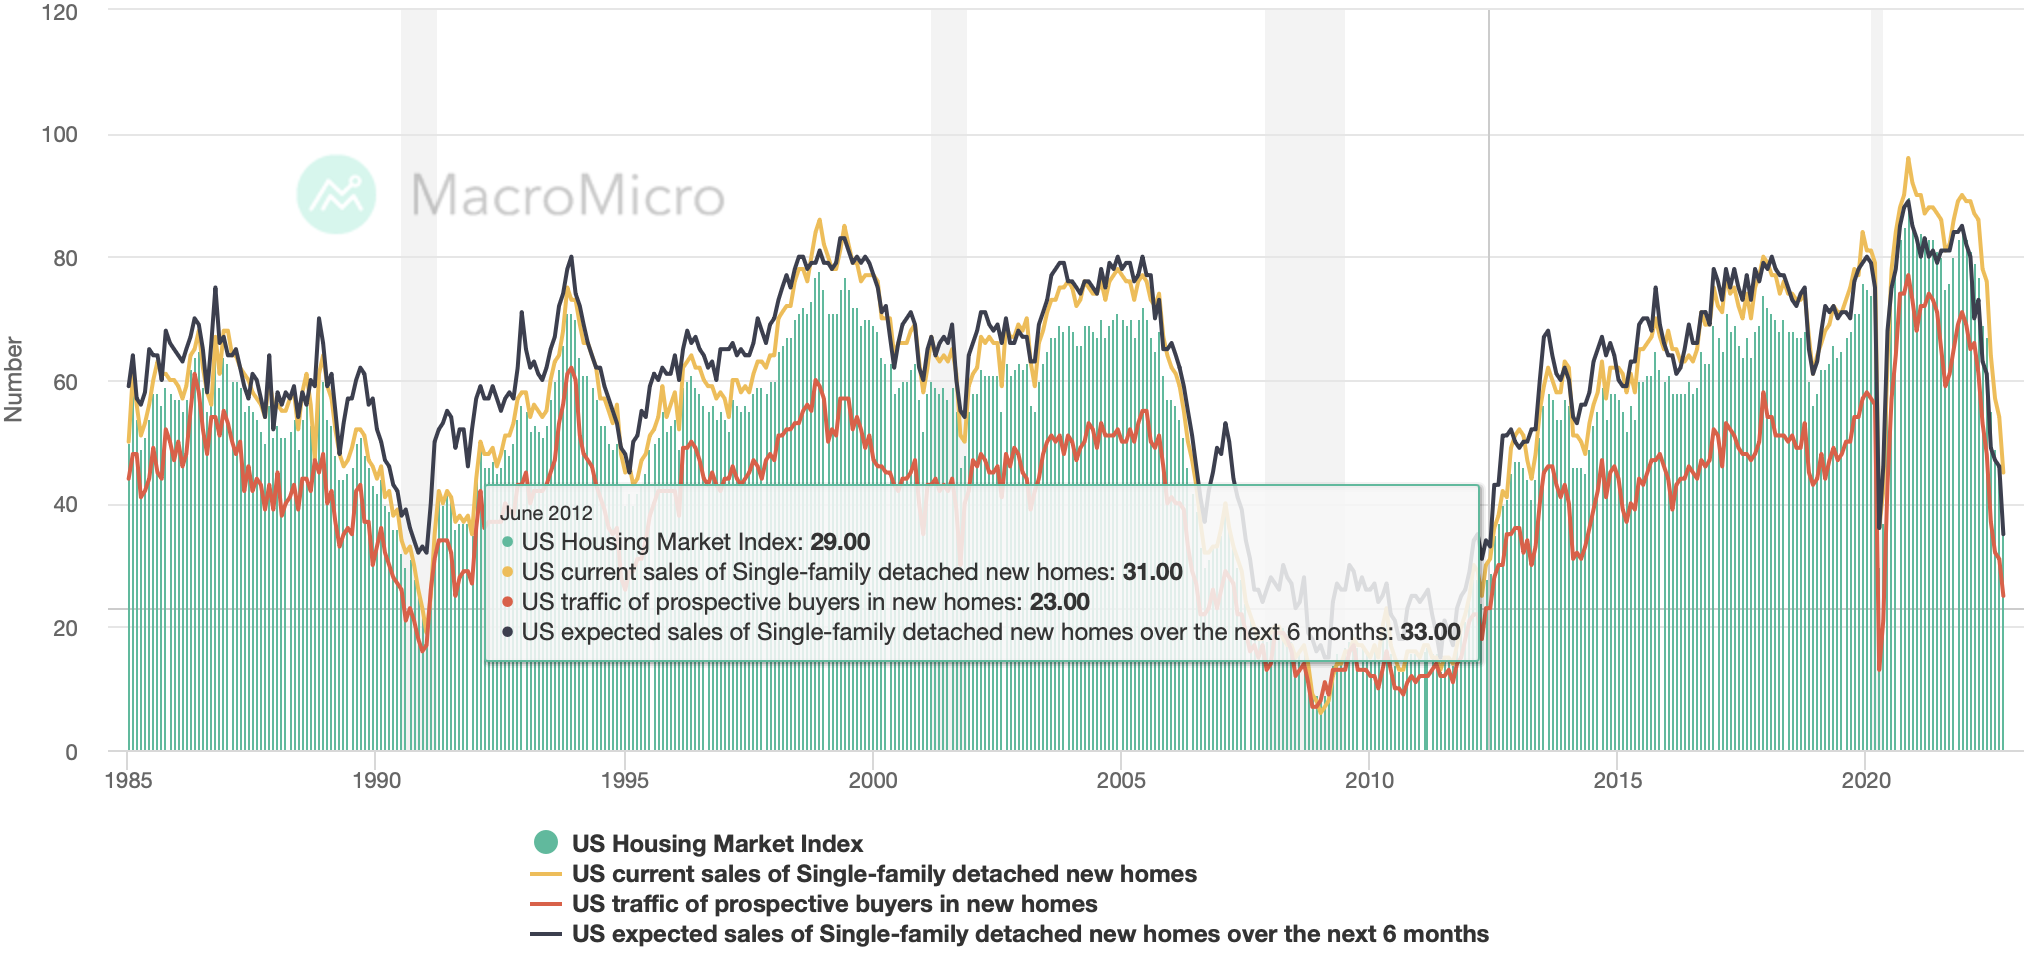
As the graph above illustrates, fewer and fewer people are out there looking at new construction. Outside of April 2020, (the beginning of the COVID lockdowns), this is the slowest foot-traffic has been in a decade. While there is no measurement I am aware of that captures foot-traffic in the existing homes market, it is logical to conclude that it is just as barren.
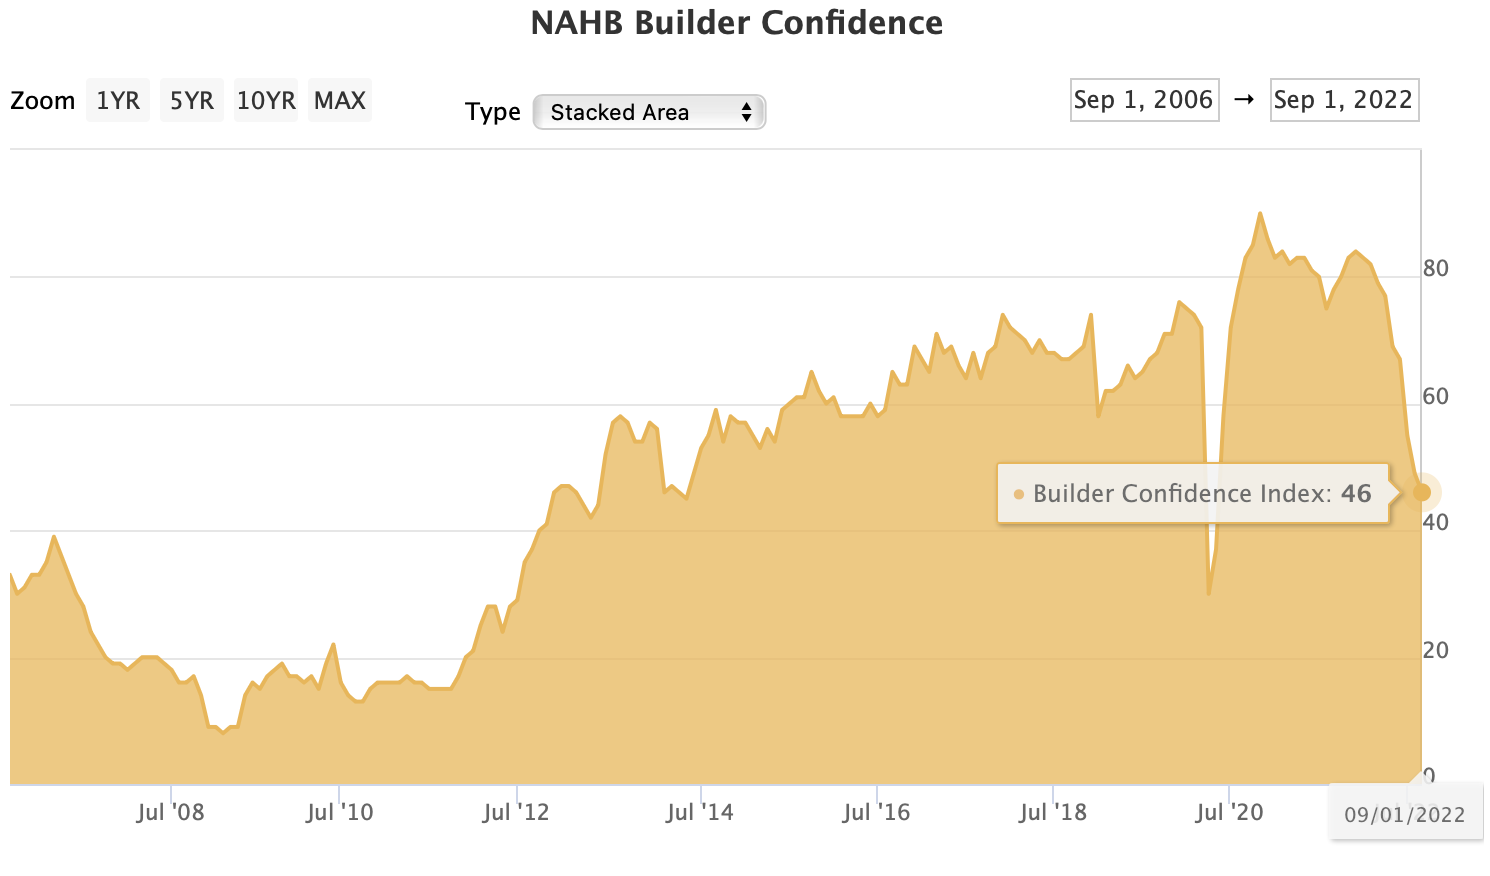
To no one’s surprise, then, the NAHB Builder Confidence survey is now at its most dismal reading (46) since November 2012. Any reading below 50 is considered a pessimistic view of the new construction market in the forward-looking six months.
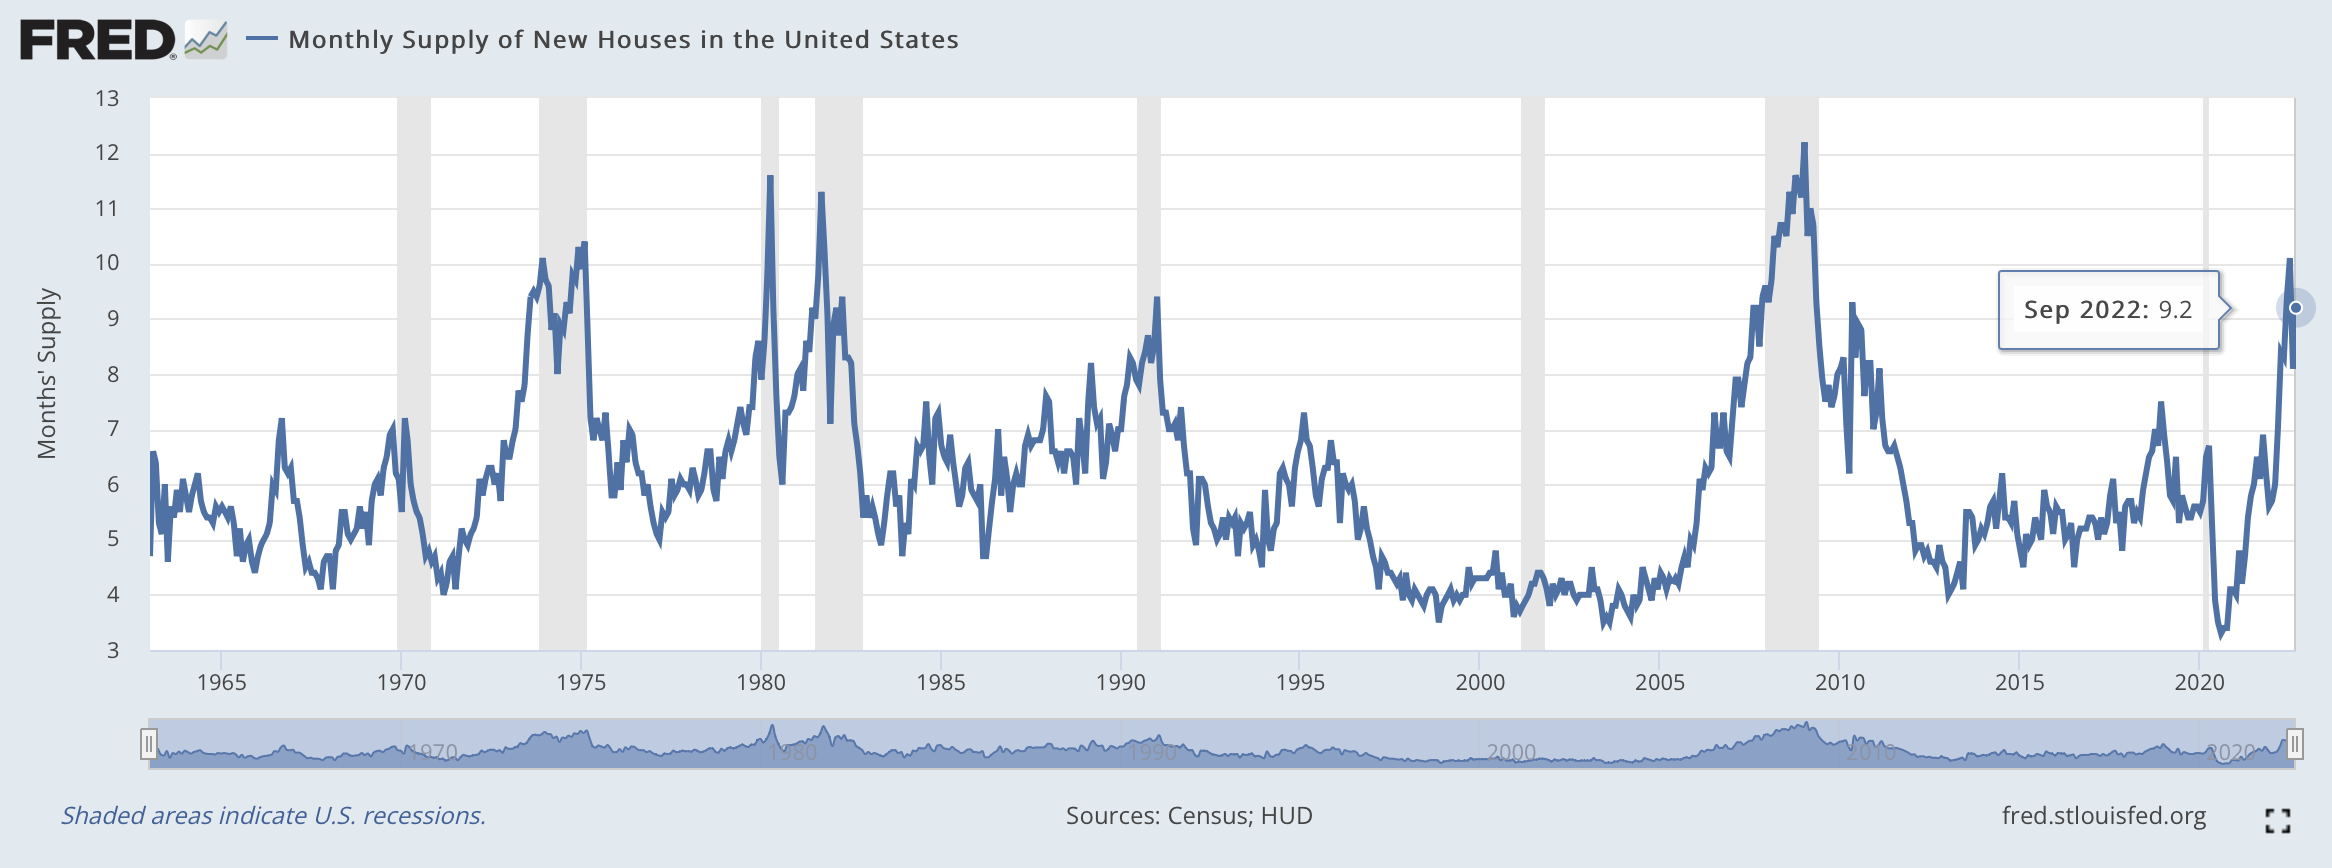
 And then there is the amount of builder inventory available. On a national level, it would take more than nine months to sell all of the newly built homes that are advertised for sale on the market today. The highest figure we have ever seen was in January 2009. Back then there was more than 12 months of new housing inventory sitting on the market.
New Home Loans Are Far & Few Between…
A forward-looking data point that tells us where we’re heading is the index of New Mortgage Applications, as reported by the Mortgage Bankers Association.
This chart below shows us, in index format, the number of new mortgage applications made on a weekly basis (blue) vs the average 30 year fixed rate mortgage (orange).
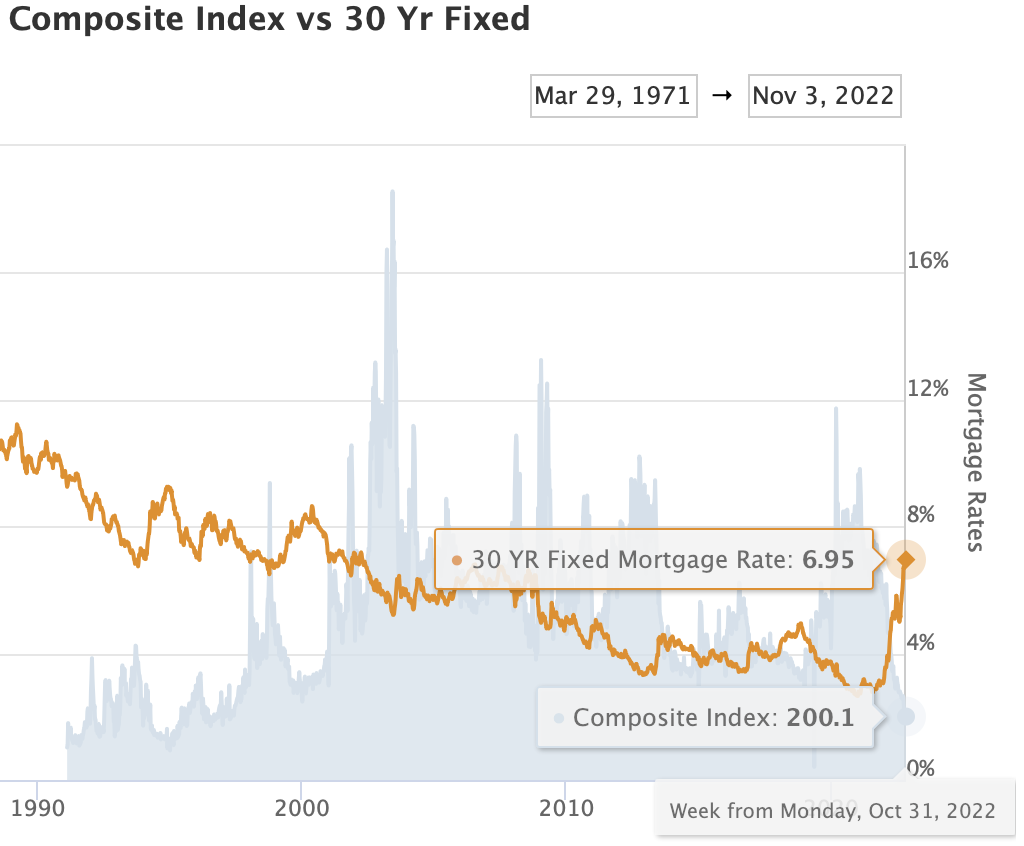
As you can see, the mortgage application index has been in a free-fall since mid-March. That is right around the time I first noticed a change in the air and began wondering aloud if our real estate market was making a shift.
As of last week, new mortgage applications were at their lowest level since April 1997.
Think about that. Fewer people applied for a mortgage last week than during any point of the Great Recession or dot com bubble bursting era.
I was a Junior in high school the last time this few people applied for a mortgage! Liar Liar was the top-grossing movie at the box office, and Bill Clinton was sitting in the Oval Office.
This chart is forward-looking because when someone is buying a house, they first apply for a loan! It then usually takes somewhere between 30 and 45 days for the loan to clear and the house to sell.
So, this chart is telling us we should expect a very large drop in home sales in the months ahead… perhaps becoming the fewest number of home sold across America in the past 25 years.
Is Nolensville Real Estate Going to Crash?…
Locally, I doubt we’ll see as profound a depression in home sales as what will be experienced across the rest of America.
Greater Nashville, and Williamson County in particular, represent an in-demand area that remains an incredible draw, even with expensive homes and high interest rates. Corporations continue relocating their workforces here, and countless other people are coming for our lower taxes and better quality of life.
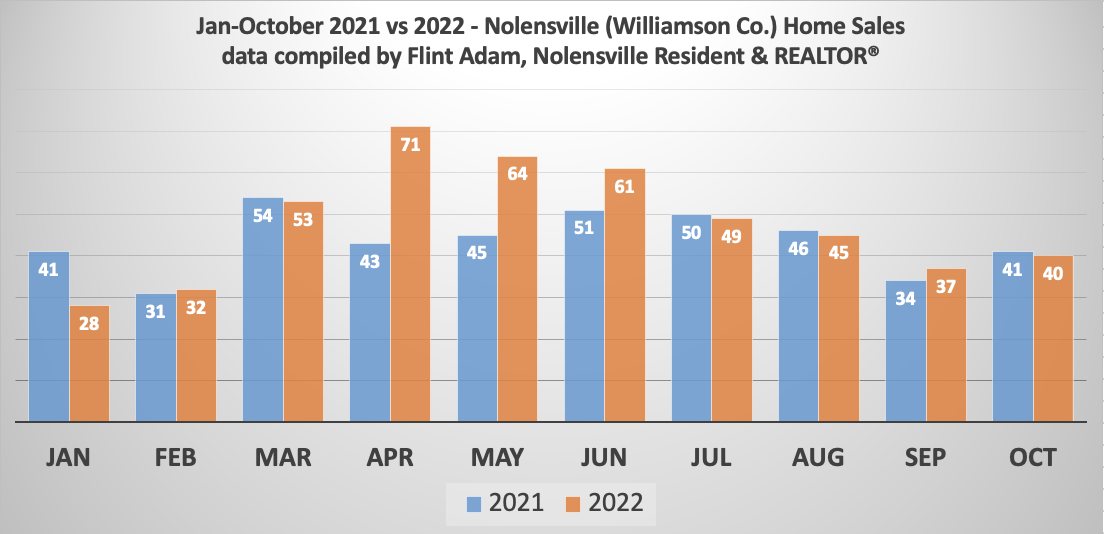
Through October, sales have remained strong. Nolensville (Williamson County) remains ahead of last year’s sales pace:
- 2021 Home Sales, January – October = 436
- 2022 Home Sales, January – October = 480… (+10.09%)
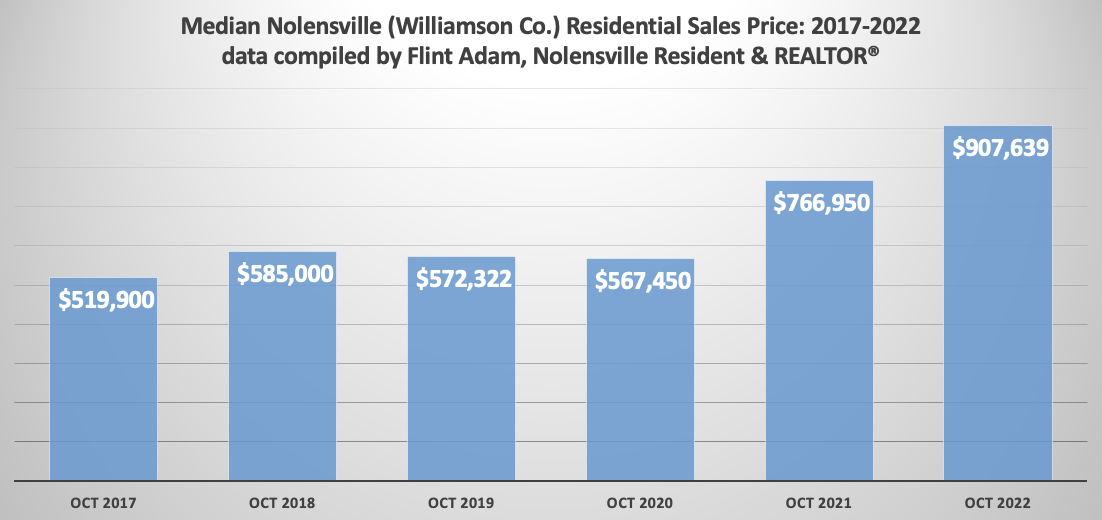
Year-over-year, median home prices in Nolensville also remain… robust:
- October 2021 Median Sales Price = $766,950
- October 2022 Median Sales Price = $907,639… (+18.34%)
And just look at how much home prices have shot up in the past two years… +59.95%!!!
But, therein lies the problem – affordability. Home prices are sixty percent higher than they were two years ago, and interest rates are more than double what they were just a year ago… and almost 150% higher than they were two years ago!
If you were a well-qualified buyer and bought a home in Nolensville at the median price of $567,450 in October 2020… and your interest rate was the typical 2.81% interest rate for a 30-year fixed mortgage… here is what your payments looked like at the time:
Nolensville home purchased October 2020 for $567,450
- 20% down payment = $113,490 due at closing
- $453,960 financed at 2.81% interest rate = $1,868/month (principal + interest)
Now, let’s compare these figures with today’s numbers for a well-qualified buyer who is now making a 30-year fixed, jumbo loan purchase…
Nolensville home purchased October 2022 for $907,639
- 20% down payment = $181,527.80 due at closing
- $726,111.20 financed at 6.53% interest rate (30 year Jumbo loan) = $4,604/month (principal + interest)
So, the typical buyer now finds that it is two and a half times more expensive to buy a home in Nolensville today than it was two years ago.
These figures don’t even include property tax and insurance, which are typically escrowed into the monthly mortgage. Both of those factors are more expensive than they were a couple years ago. And then there is everything else that has been affected by inflation… car payments, groceries, utilities, just to name a few.
You don’t need me to tell you that this sounds pretty damn expensive.
But, many of the people moving here are coming from states that are even more expensive to live in than Tennessee, and many of them are also flush with cash that helps offset some of the above figures.
For the people who already live here, though… the ones with Tennessee incomes and Tennessee expectations… well, this has been a shock.
This also helps explain why Moody’s researchers think Nashville’s real estate values are going to tank twenty percent. Their formulas take into account current home prices and local, household annual income. However, a lot of the real estate transactions happening here involve people relocating from other parts of the country, and their household income and existing savings aren’t accounted for in the data.
So, I’m not convinced we’re going to see a twenty percent drop in home values around here. I think five to ten percent is realistic, though. Maybe in some extreme cases a fifteen percent drop.
But, for those who have owned their homes at least two years, even a fifteen percent drop in value still leaves them with forty five percent appreciation since 2020. This is a simplification, of course, but my point is that our country – and Williamson County, especially – is much better equipped to handle a housing downturn today than we were fifteen years ago. The next year is probably going to suck for everybody in the housing market, but it won’t be the end of the world. We’ll survive this, too.
Now, we just need to knock down inflation.
Nolensville Home Owners Can Feel Good About This…
Here’s your silver lining, folks: when accounting for existing home sales only… and looking at October 2022 sales around the county… Nolensville beat our “big brother” cities of Brentwood and Franklin in sales-price to list-price ratio (SP/LP%). This means our home values held up better than Brentwood and Franklin.
Williamson County TN, Existing Home Sales Only, October 2022
- Arrington = 96.73% SP/LP | median selling price = $1,425,000
- Brentwood = 95.68% SP/LP | median selling price = $1,082,600
- College Grove = 99.80% SP/LP | median selling price = $805,000
- Fairview = 98.51% SP/LP | median selling price = $455,000
- Franklin = 97.28% SP/LP | median selling price = $715,000
- Nolensville = 97.79% SP/LP | median selling price = $740,000
- Thompson’s Station = 97.91% SP/LP | median selling price = $682,500
Speaking of October… let’s go ahead and analyze Nolensville’s real estate figures last month.
October 2022 Nolensville Real Estate In Depth…
Since I just mentioned Nolensville’s Sales-Price to List-Price ratio for October, let’s go ahead and cover what has happened so far this year.
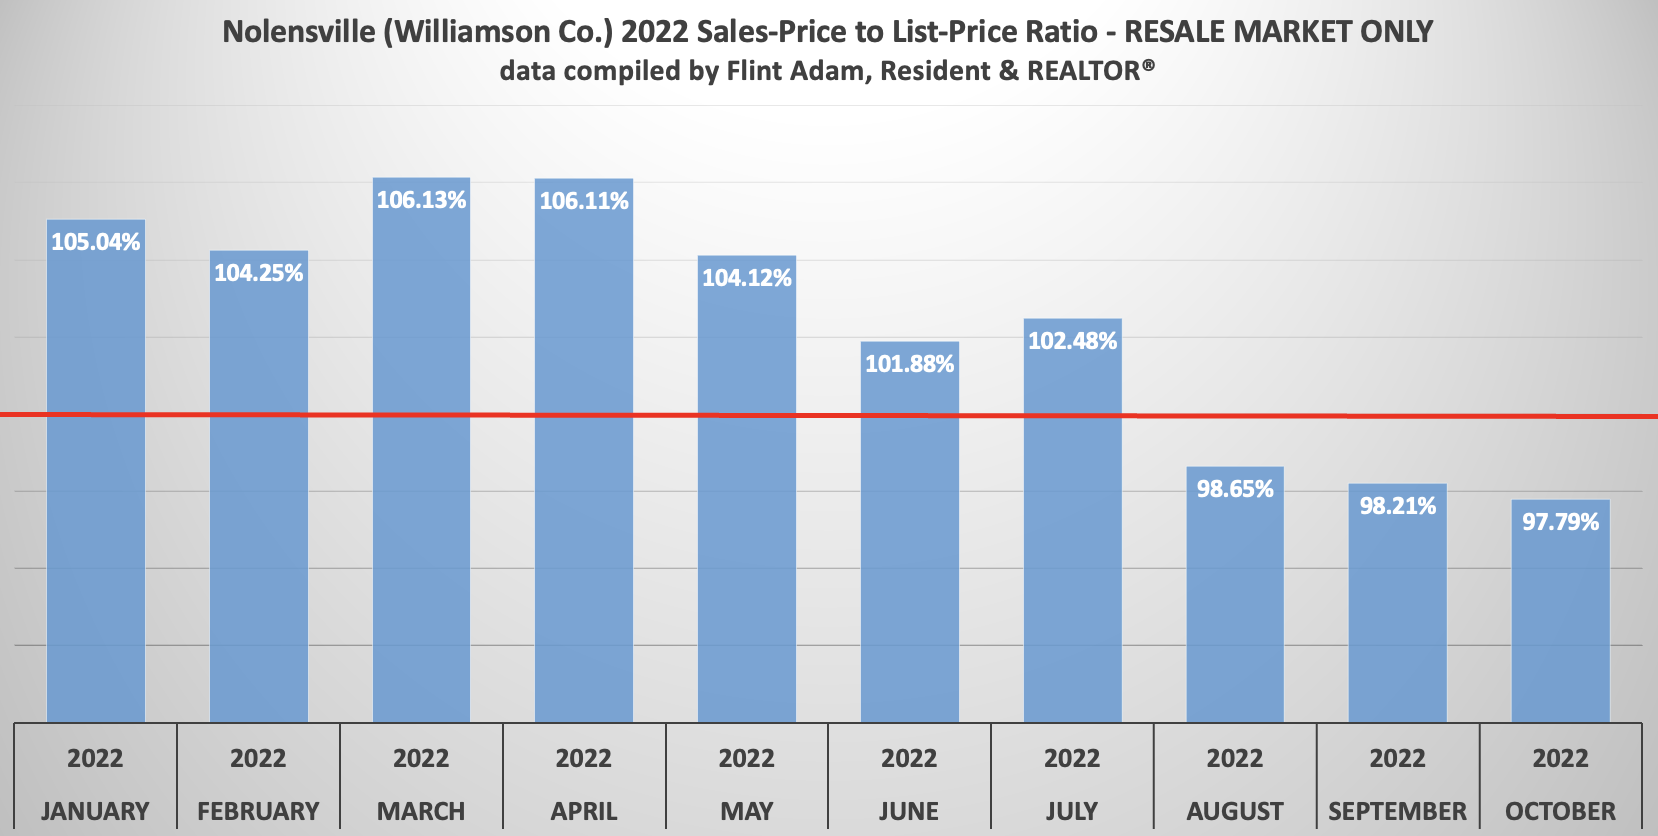
We began 2022 on the same path we were on through much of 2021, homes selling above asking price in ultra-competitive bidding wars. It all peaked in March when the typical home buyer was paying 6.13% above asking-price to purchase a home in Nolensville. April sales were just as competitive, though the turn had begun, and by the start of school the market had completely fizzled out.
The past three months, buyers have had ever-increasing inventory to choose from, and sellers have lost leverage as interest rates spiked to levels unseen in fifteen years. That led to last month’s SP/LP ratio among existing home inventory in Nolensville dropping to the lowest figure we have seen since October 2019 (97.23%).
Even so, the total number of October home sales in Nolensville (Williamson County) this year was on-par with where we have been each of the past six years.
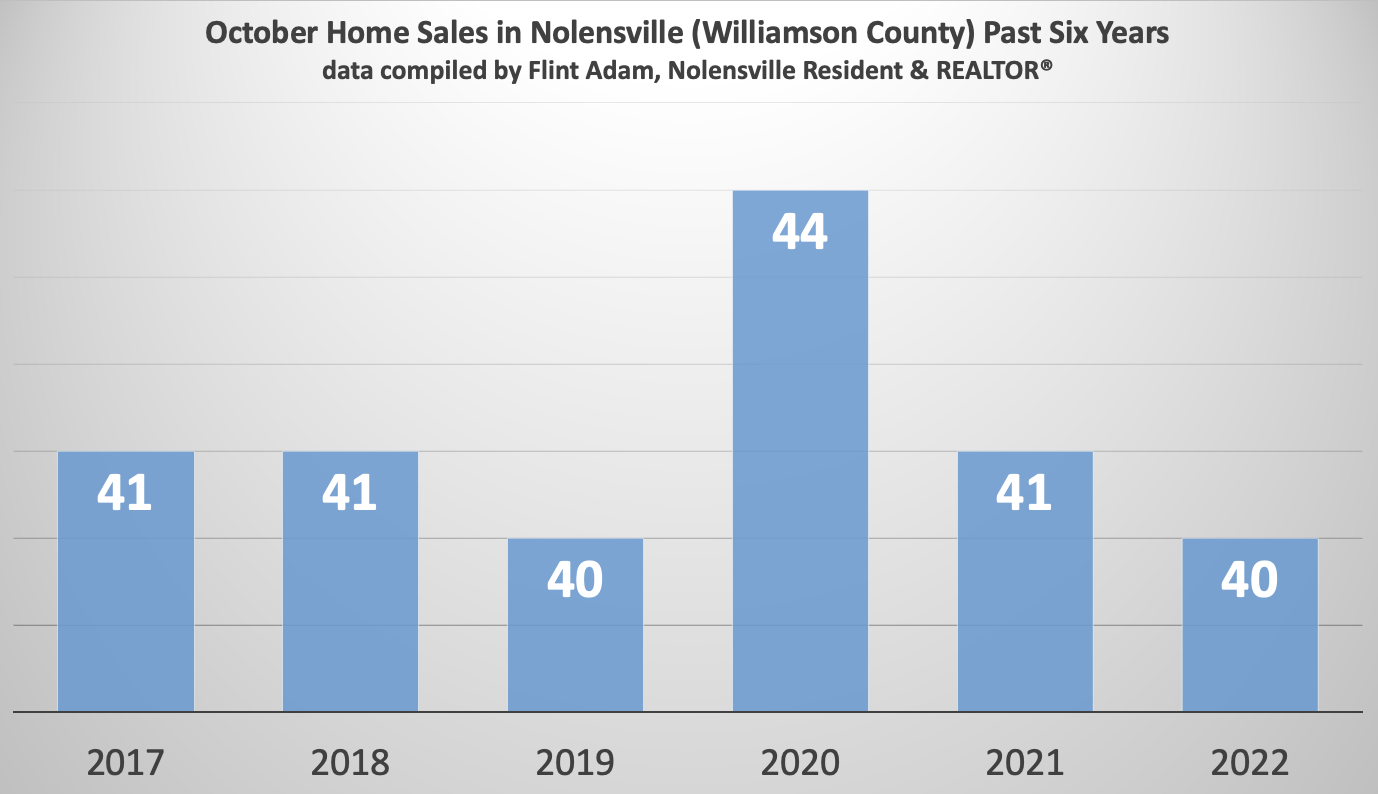
October 2022 vs. October 2021 Nolensville Home Sales:
- 40 Nolensville (Williamson Co.) homes sold… down from 41 (-2.44%)
- The median sales price was $907,639… up from $766,950 (+18.34%)
- The average days on market was 18… up from 5 (+13 days)
- The sales-price to list-price ratio was 97.79%… down from 100.76% (-2.97%)
- 26 of the 40 homes (65%) sold were new construction
- The lowest price sale was 7810 Nolensville Rd., a lot with a tear-down, for $100,000.
- The highest price sale was 1029 Annecy Pkwy. in Annecy for $1,800,000.
Deeper Dive:
- When we eliminate new construction and larger acreage properties and look solely at subdivision resales (13 total), some interesting figures come to light:
- The median sales price becomes $755,000
- The average sales-price to list-price ratio grows to 98.62%
- 1 of the 13 sales (8%) is above asking-price
- 6 of the 13 sales sold (46%) below asking-price
- No homes sold for all-cash
- The average days on becomes 23
- 2 of the resales had a contract fall through before selling
- 3 of the resales had to price-reduce before going under contract
*Note: The information above cites Williamson County sales data for Nolensville, Tennessee. There is, of course, a small percentage of Nolensville homes that exist in Davidson and Rutherford counties, but for continuity in my blogging I reference only Williamson County statistics.
Williamson County Sales Stats…
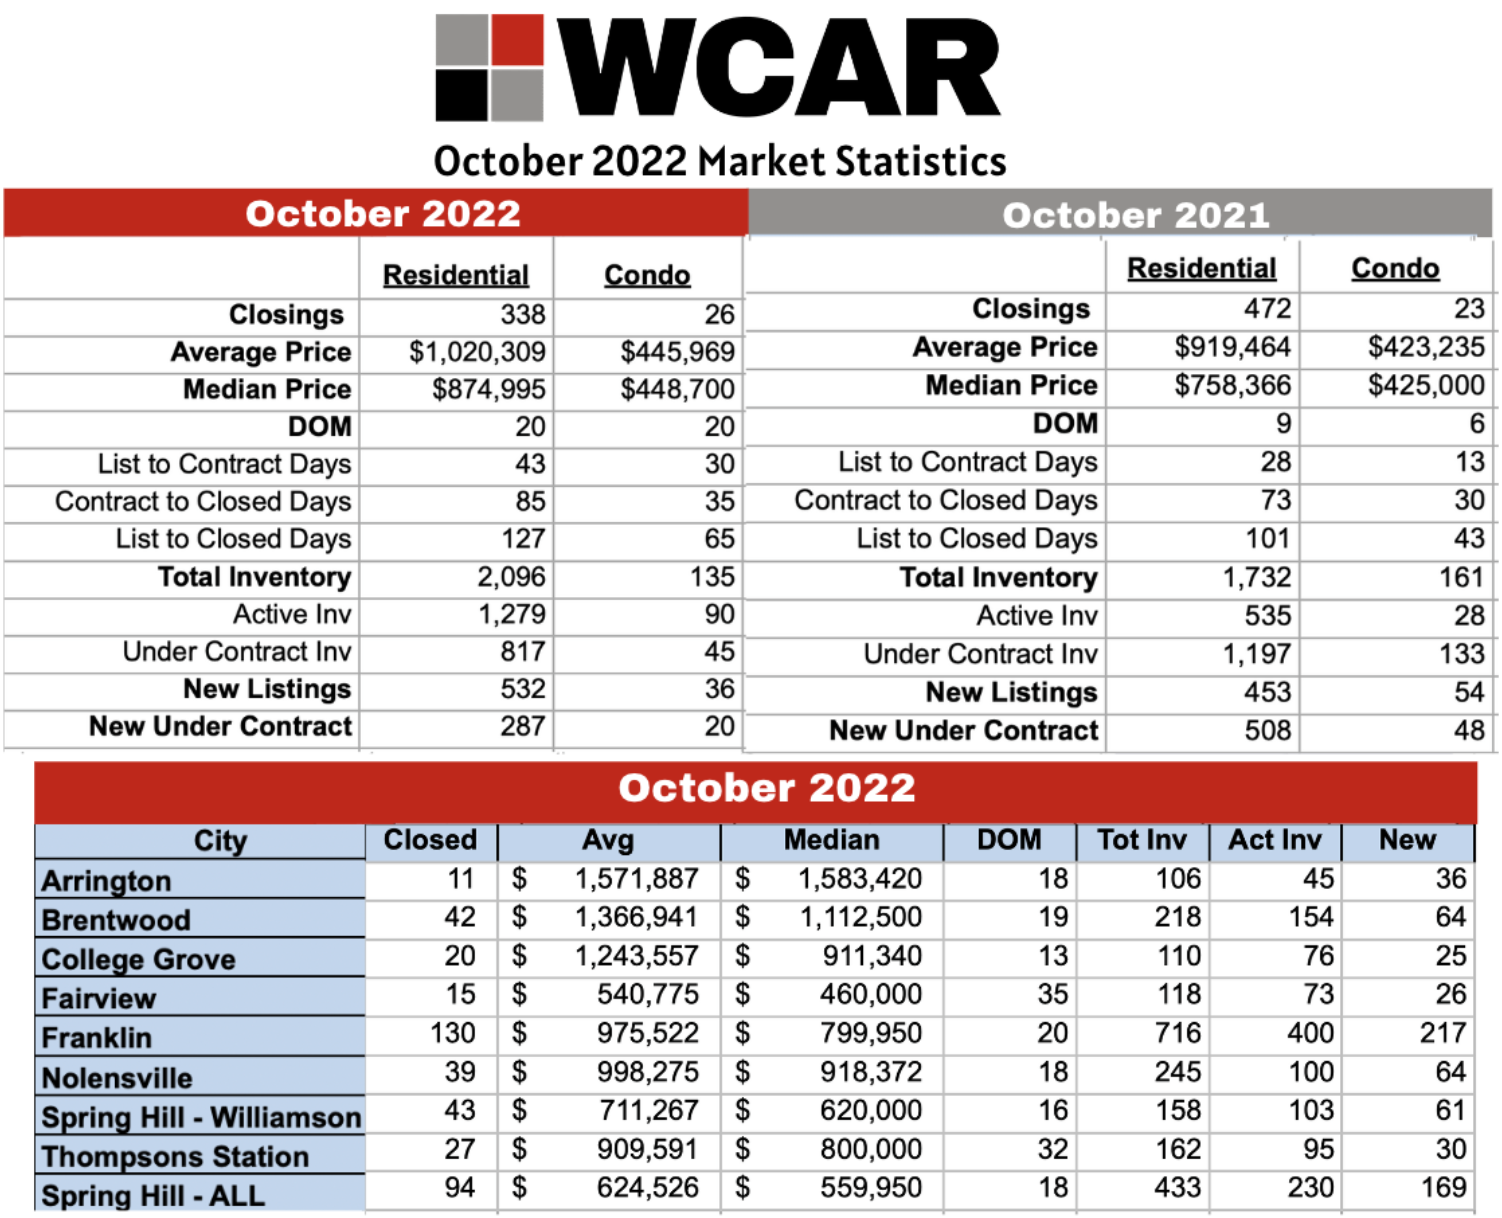
Last month, Williamson County active/available housing inventory was 139% higher than during the same period last year. Meanwhile, new contracts fell by 43.5% from October 2021.
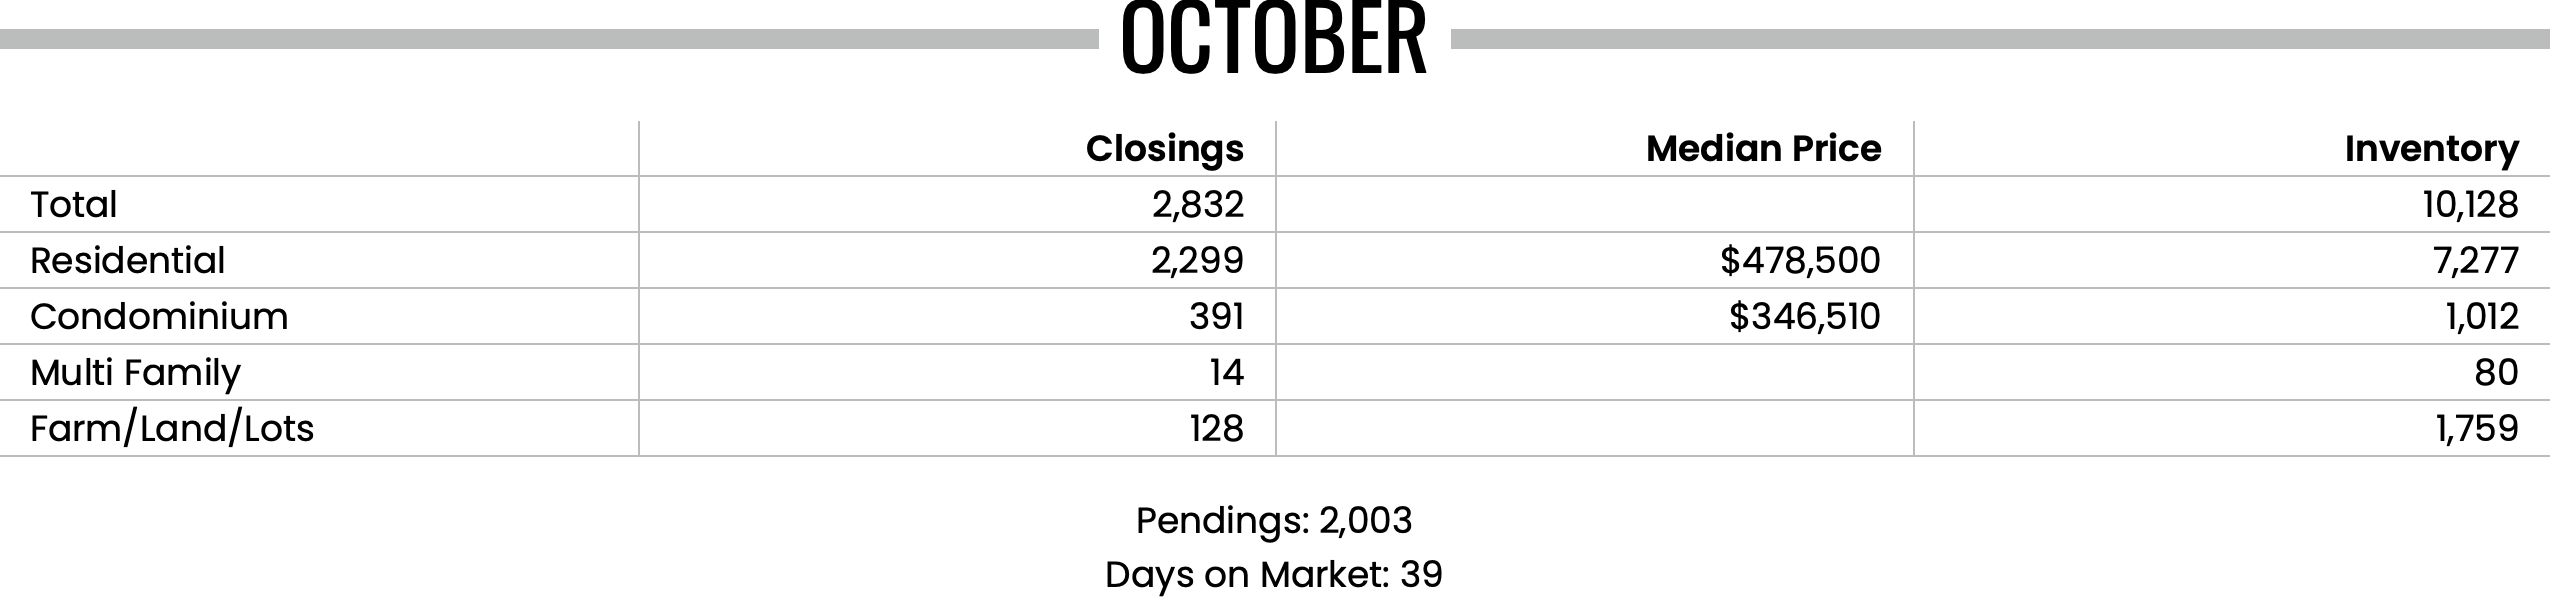
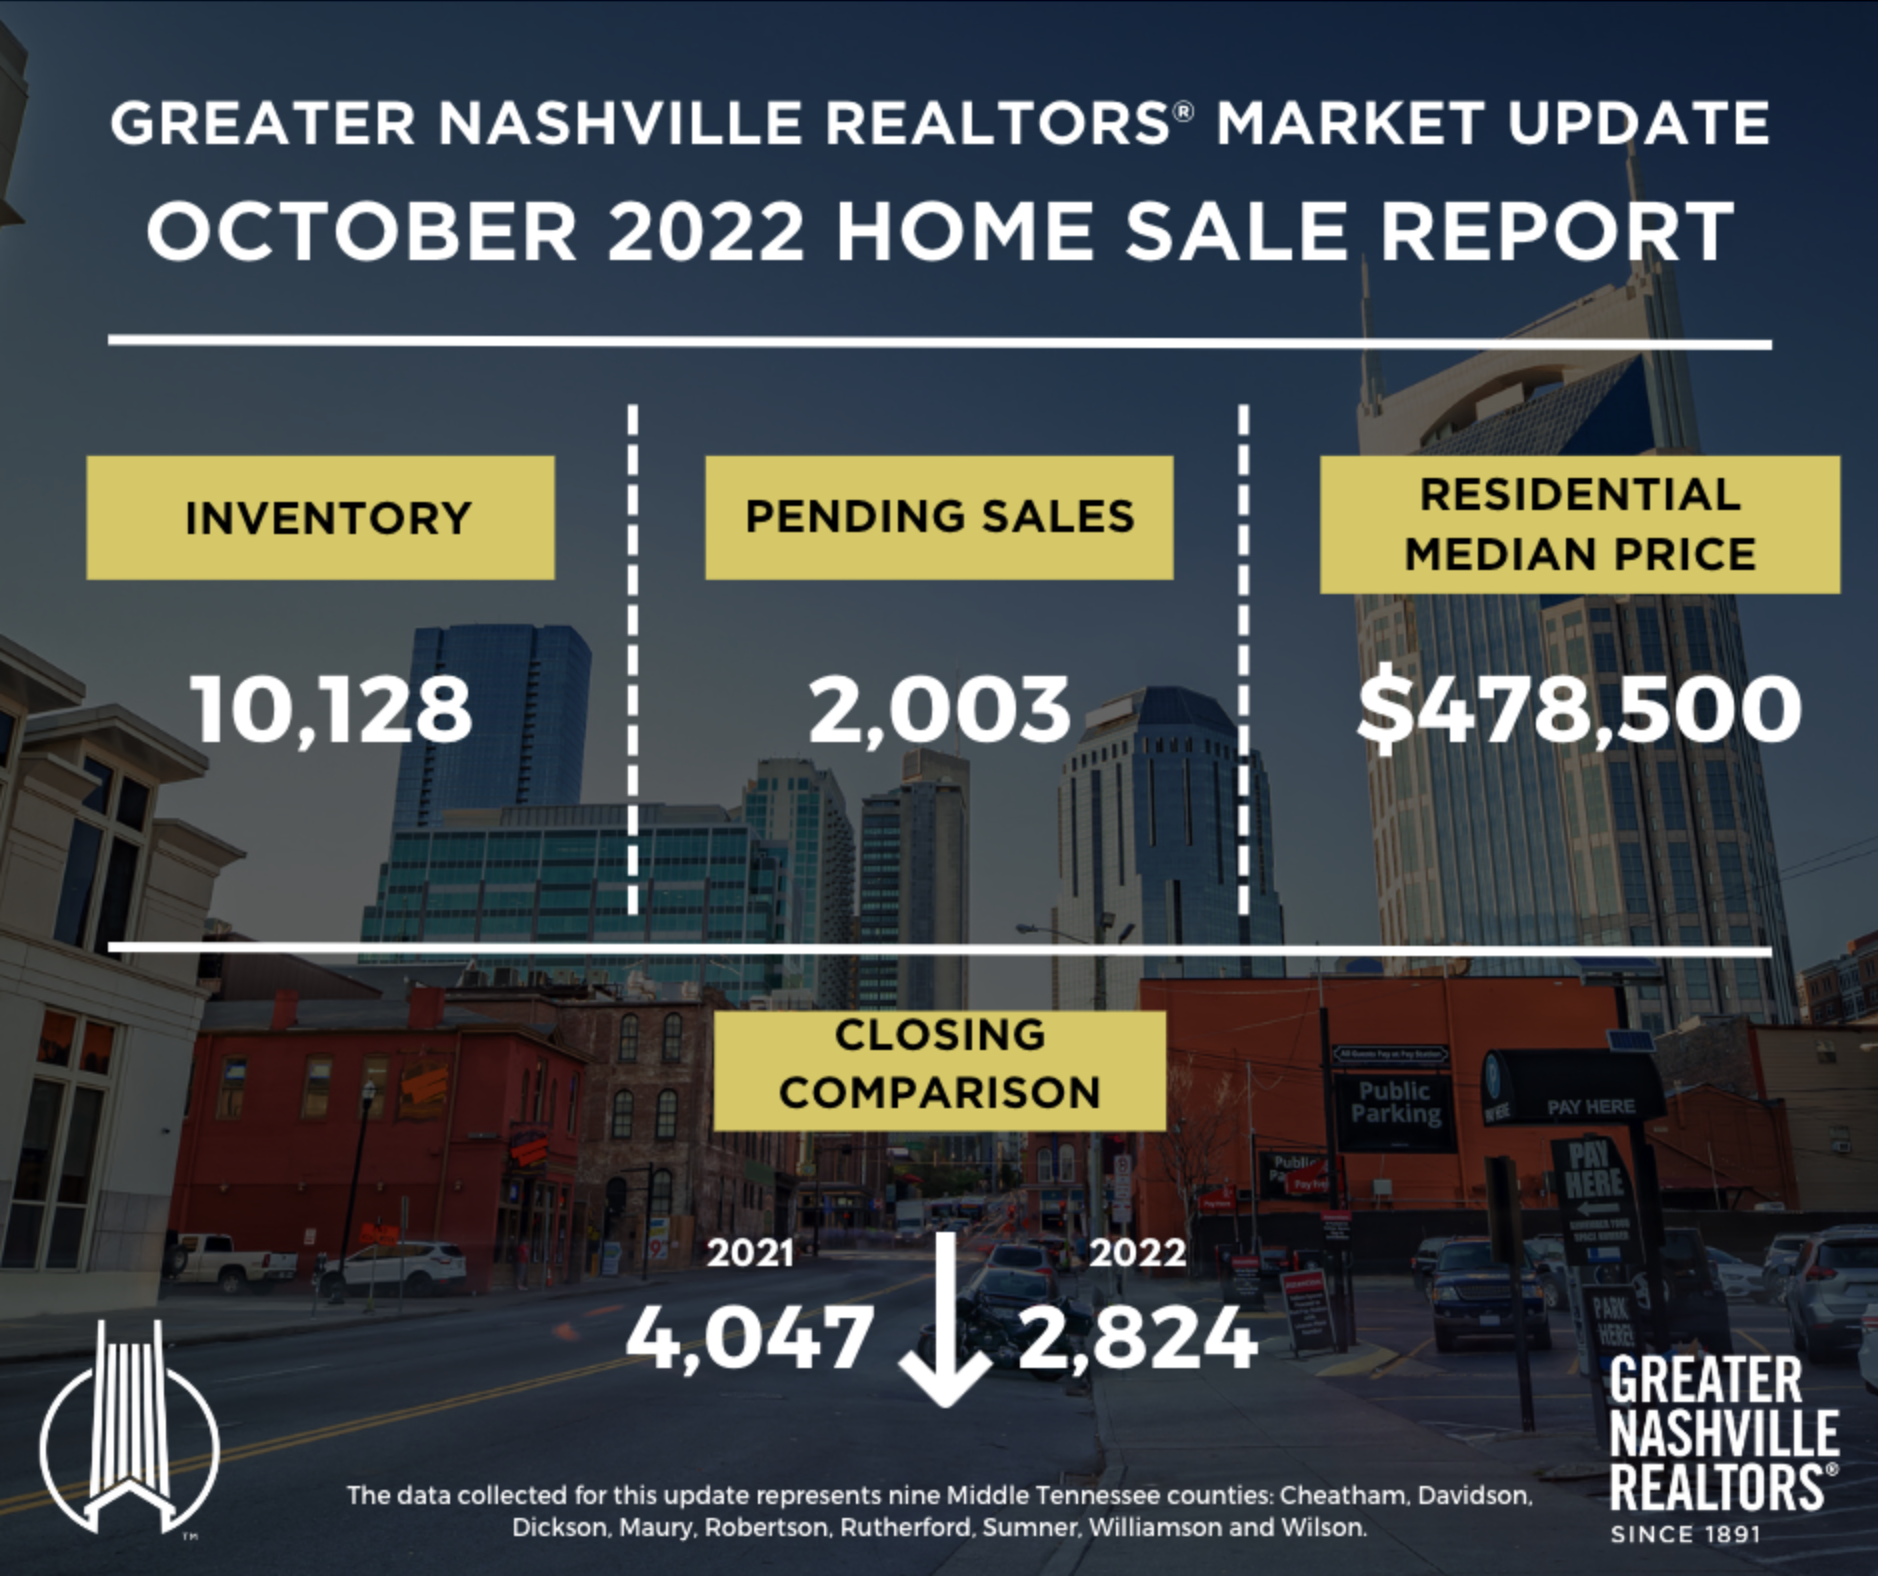
Greater Nashville Sales Stats (includes Williamson Co.)…
In Conclusion…
There are a lot of challenges ahead, folks, and the next few months in the real estate market may be even more difficult than the ones we just made it through.
BUT… some things are changing. We have made it through elections and now some uncertainty has been pulled off the board. The Consumer Price Index (CPI) report came out today and was slightly better than expected. That set off a market rally that carried stocks to huge gains, and also brought treasury yields down. In turn, that improved mortgage interest rates today by a significant amount!
I’m optimistic that rates will come down further, and once we get through the holidays people are ready to start buying and selling real estate again.
In the meantime, if you’re a seller – a sound marketing strategy and realistic pricing is paramount. Buyers are not overpaying for great homes right now, and they’re punishing properties that have imperfections.
As for buyers, a lot of them I have spoken with are sitting in neutral waiting for prices to continue dropping. My advice is to go after the home you’re interested in. Interest rates have just come down, and sellers are willing to negotiate. You can get really great terms on a house right now – especially if it has been on the market several weeks.
If you’re interested in buying or selling, it’s time you speak with a veteran professional who doesn’t panic in market shifts and can put together an action plan that will guide you to success.
Give me a call at 615-500-6393 or email me at flint@theguidehome.com and let’s chat about your goals. It may be best for you to stay put, and if so – I’ll give you that honest opinion. But if there’s a window of opportunity, I’m going to help you open it right on up.
Interested in up to date Nolensville TN real estate sales figures? I’ll email you an HOURLY UPDATED look at Nolensville real estate activity including what has gone pending, price-reduced, and withdrawn. Just shoot me an email with your name and preferred email address to flint@theguidehome.com
The Latest on Mortgage Rates…
 11/10/2022 Commentary by Nolensville resident, Jesse Alvarez, with The Mortgage Exchange
A lot has changed since my last writing in this blog. Mortgage demand continues to weaken and inflation has not gone away in spite of all the world-wide monetary policy that continues to push rates higher. The U.S. Federal Reserve kept their foot on the pedal, but it hasn’t put a real dent in consumer demand just yet. However, it’s only a matter of time before it does. The problem is, the longer it takes and the more they raise rates to get to that point, the more likely it is that there will be no proverbial soft landing in the economy.
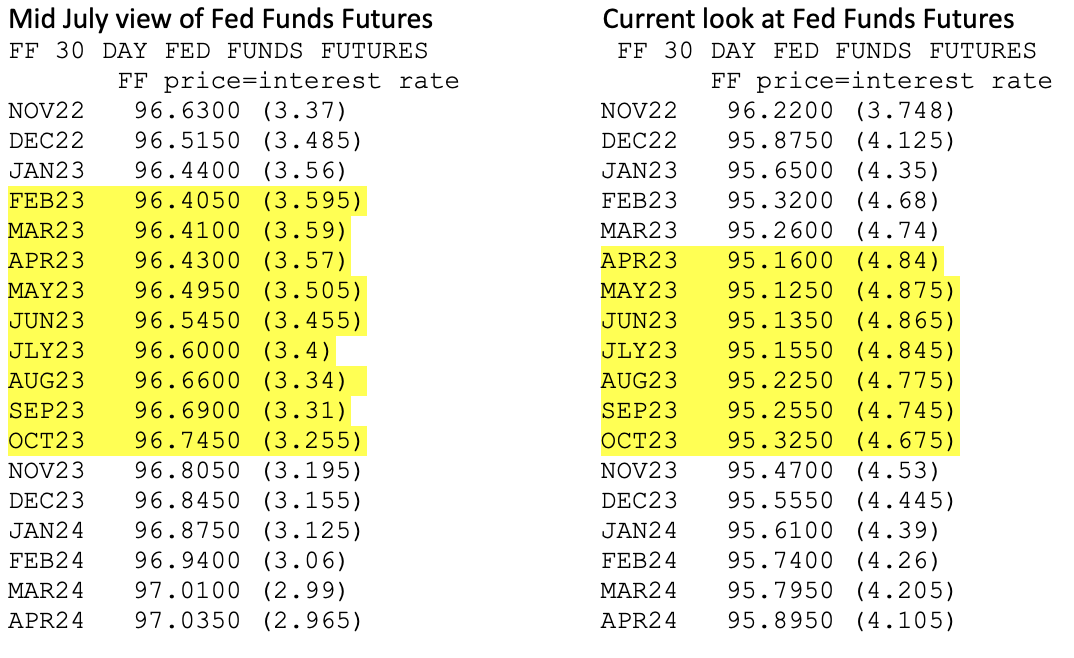
The average 30 year mortgage rate is now around 6.62% (Yesterday we were above 7%!). A better then expected CPI (inflation report) number today helped reign in interest rates for now as the market is really grasping at any good news it can find. Fed Funds futures continue to show rates peaking in April or May of 2023. This difference between now and three months ago is that the peak Fed Funds rate is now 100bps higher (1%=100bps). This scenario would still lead to mortgage rates being considerably lower in 2024. But in this scenario, they would be considerably lower then the 6.5% to 7% range, versus the 5.5% to 6% peak range we were looking at two months ago.
Below you will see side by side comparisons of Fed Funds Futures from three months ago versus today so you can get an idea of how the interest rate market has changed over that time. The highlighted areas show where rates are projected to peak and how they begin to taper off from there. This doesn’t mean they are actually predicting rate cuts, it just points to a percentage chance of a rate cut happening around that time. The mortgage market tends to stay ahead of treasuries. So when short and long term treasuries begin to “look” like they will be moving in the future, mortgage rates usually start making their move in that direction.

Flint Adam is a 12- year Nolensville resident and lives with his wife and children in Bent Creek. He focuses his real estate practice here in town, having served more than 180 buyers and sellers in closed Nolensville real estate transactions. Flint enjoys blogging about local real estate, traveling the world, photography, and hiking. He is passionate about serving Nolensville and keeping it one of America’s greatest small towns.