

by Flint Adam, Nolensville resident & REALTOR®
Almost one-third fewer homes sold last month in Nolensville than during June 2020, the early onset of the COVID-19 epidemic. The significant drop-off in sales wasn’t for lack of need or interest, but rather a considerable shortage of inventory that has typified many industries across the globe this spring and summer.
While overall home sales plummeted year-over-year, the median sales price in Nolensville jumped to $705,550 from $559,812 (+26.03%). This is consistent with real estate elsewhere in America. Nationally, the median price of home sales jumped almost 24% in May, the most recent month that data is available.
The average price of a Nolensville home last month was $715,336 (+23.4%). Both the median and average sales prices were the highest ever. The average, 30-year fixed-mortgage rate was nominally lower on June 30th (3.18%) than the year prior (3.37%).
Comparing the top-50 metros in the U.S., Nashville had the lowest year-over-year percentage of new listings hitting the market in May (-31.7%), and second worst availability of homes to purchase (-71%). Anecdotal evidence leads me to believe June’s numbers may look even more depressed.
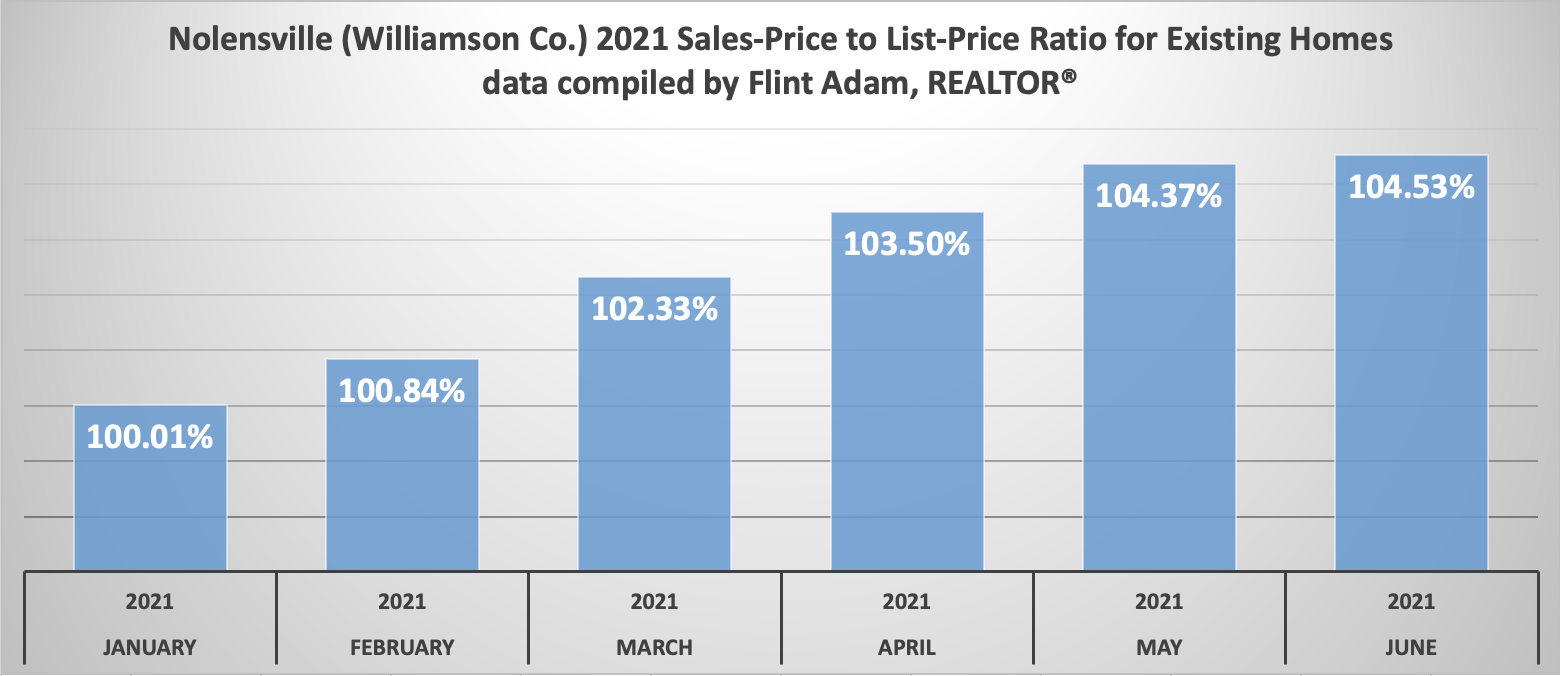
There are early signs of the Nolensville real estate market leveling off, though. Peering only at existing home sales in June, four of twenty-nine closings came in at asking-price, and two homes sold below asking-price. The selling-price to list-price ratio among existing home sales last month came in at 104.53%. This is almost even with the 104.37% SP/LP from May, the first time we have seen anything close to stability for these numbers this year.
July will hold plenty of intrigue as it is the final month before school begins and is typically the top month for real estate sales each year. In July 2020, a record-setting, eighty-nine home sales closed in Nolensville.
Don’t expect anything near that figure this year.
Potential August home sales, meanwhile, look like they’ll significantly reduce as well. I wouldn’t be surprised if this becomes the third-slowest August for Nolensville home sales in the past decade. Based on current pending contracts, I would expect somewhere between fifty and sixty closings. Seventy Nolensville homes closed during August 2020.
Barring a sudden surge of existing homes hitting the market, I believe September will also rank among the top-three lowest September home-sales of the past decade, with an outside chance of ranking worst.
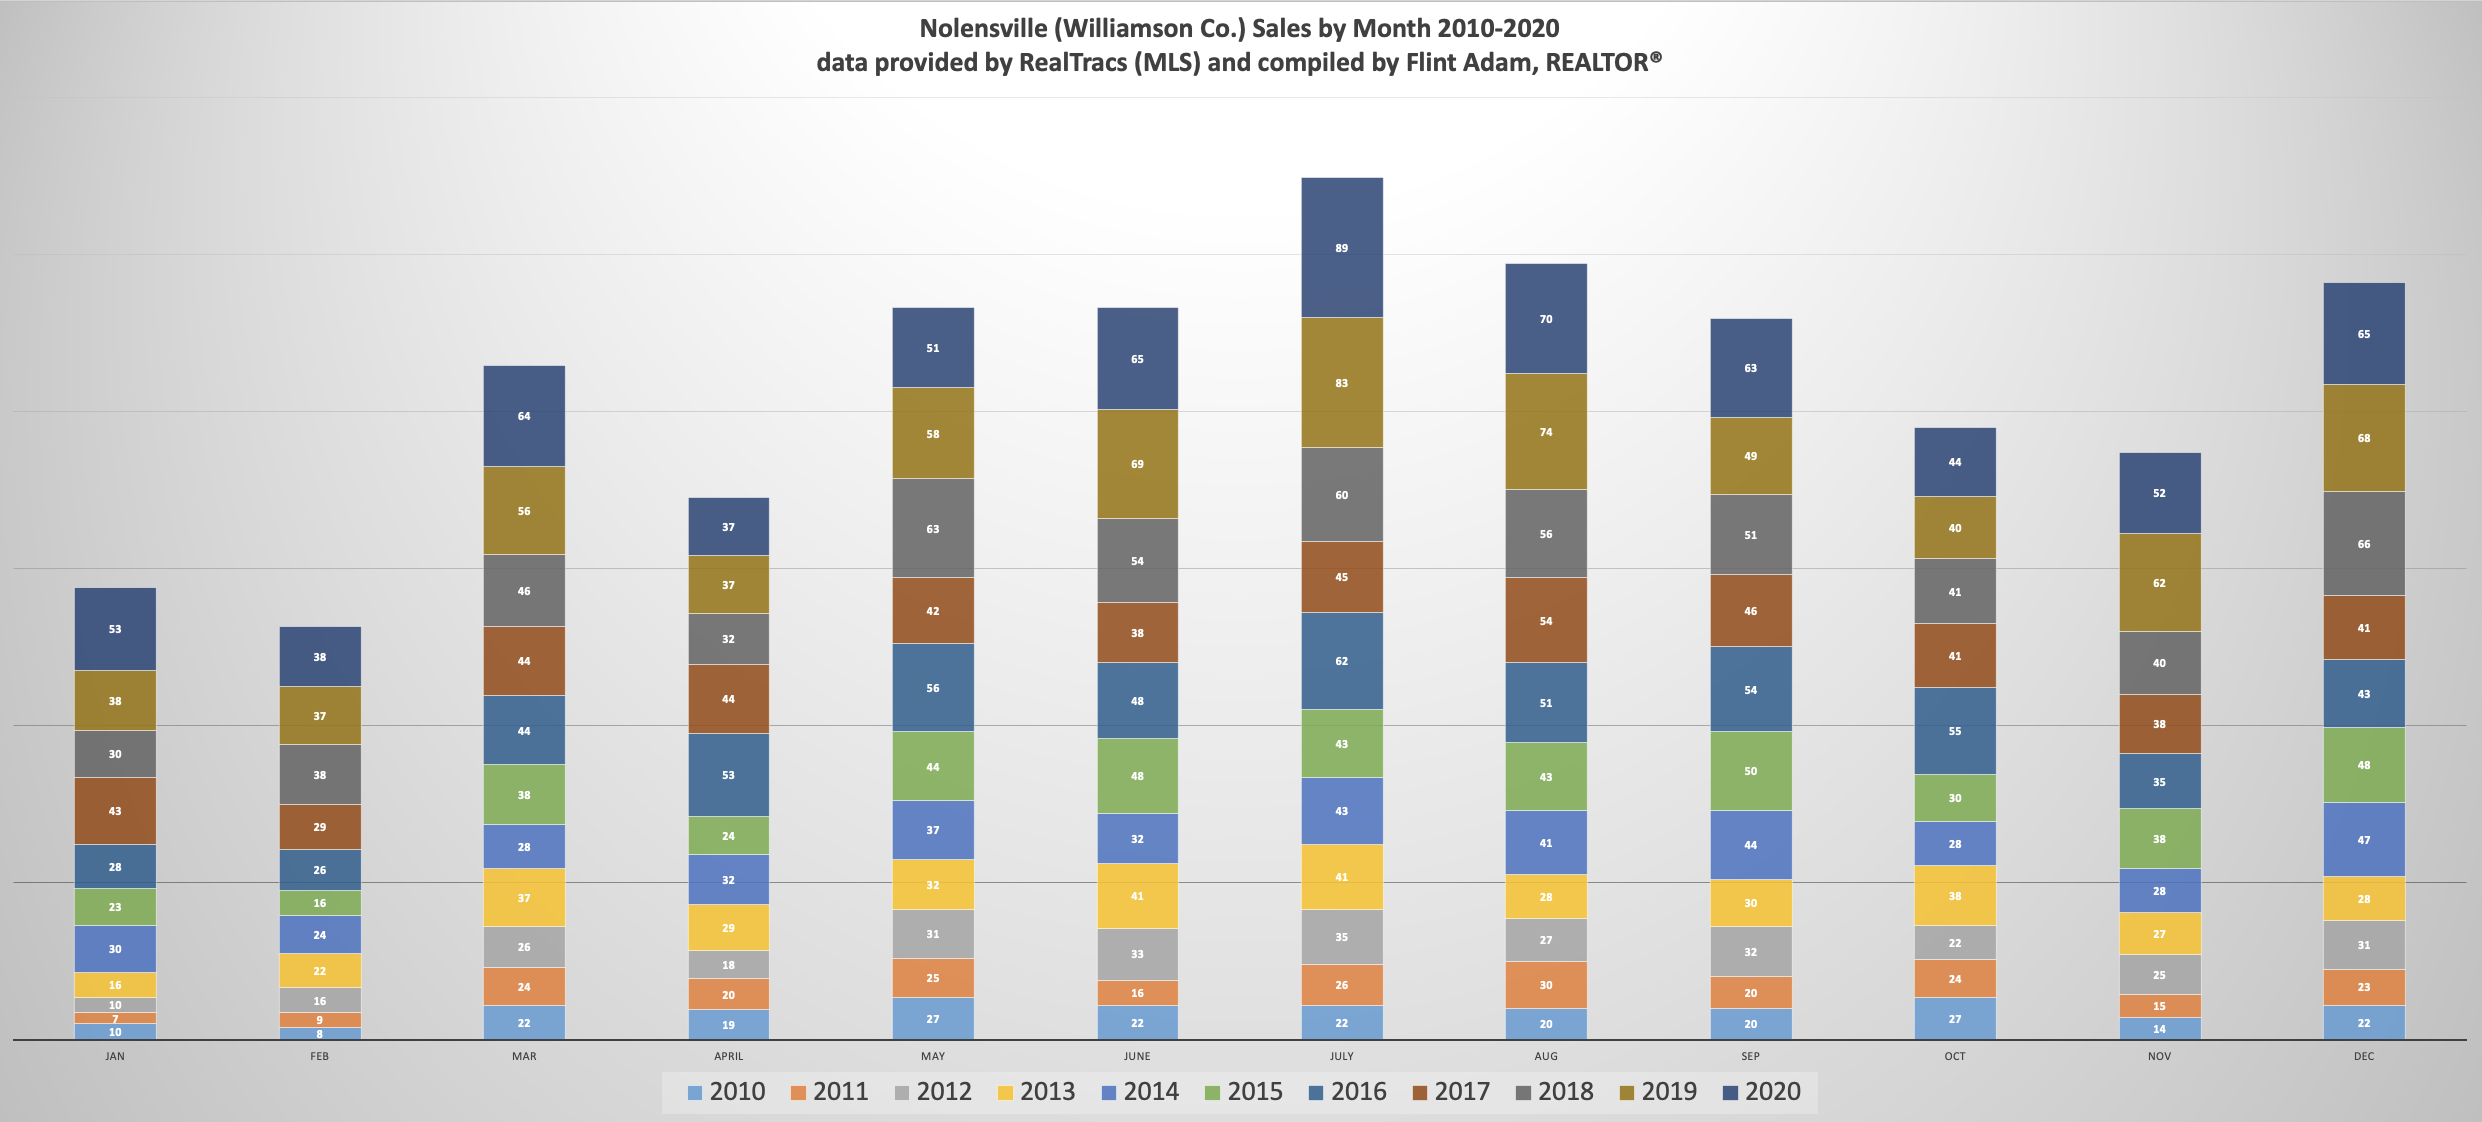
If you’re thinking of selling, now is probably as good a time as ever to jump in the pool. Home prices remain at peak level, but the window of time before school starts is narrowing. Once we head into August, the mad rush of buyers swarming into Williamson County may ease a bit. As the above chart illustrates, activity begins tapering off as we move into fall with a pop in December that is usually attributed to new construction.
If you’re considering buying, don’t waste any time! Mortgage interest rates remain exceptionally low, but I fear inventory will, too. Once school starts, we’ll probably see fewer homes come to market. It’s already looking pretty drab…
While you chew on all of that, see last month’s sales stats in detail…
June 2021 sales stats vs. June 2020:
(Sales Data is for Williamson County Nolensville only. This will be revised once the Williamson County Association of REALTORS releases final stats in about a week.)
- 45 Nolensville (Williamson Co.) homes sold… down from 65 (-30.77%)
- The average sales price was $715,336… up from $579,675 (+23.40%)
- The average days on market was 4… down from 28 (-24 days)
- The list-price-to-sales-price ratio was 103.41%… up from 99.81% (+3.61%)
- 16 of the 45 homes (36%) sold were new construction
- The lowest price sale was 619 Weybridge Dr. in Nolen Mill for $389,900.
- The highest price sale was 235 Belgian Rd. in Benington for $1,250,000.
And here are some of the crazy facts:
- When we eliminate new construction and larger acreage properties and look solely at subdivision resales (28 total), some extraordinary figures come to light:
- The average sales-price to list-price ratio grows to 104.69%
- 23 of the 28 sales (82%) are above asking-price… anywhere from $6,000 to $85,100
- The average overage of the above-asking price sales is $38,884
- All-cash purchases make up 7% of sales
- The average days on market remains at 4
- 0 of the 28 resales had a contract fall through before selling
- Only 1 of 28 resales had to price-reduce before going under contract
Nolensville PENDING Resales as of 7/6/2021…
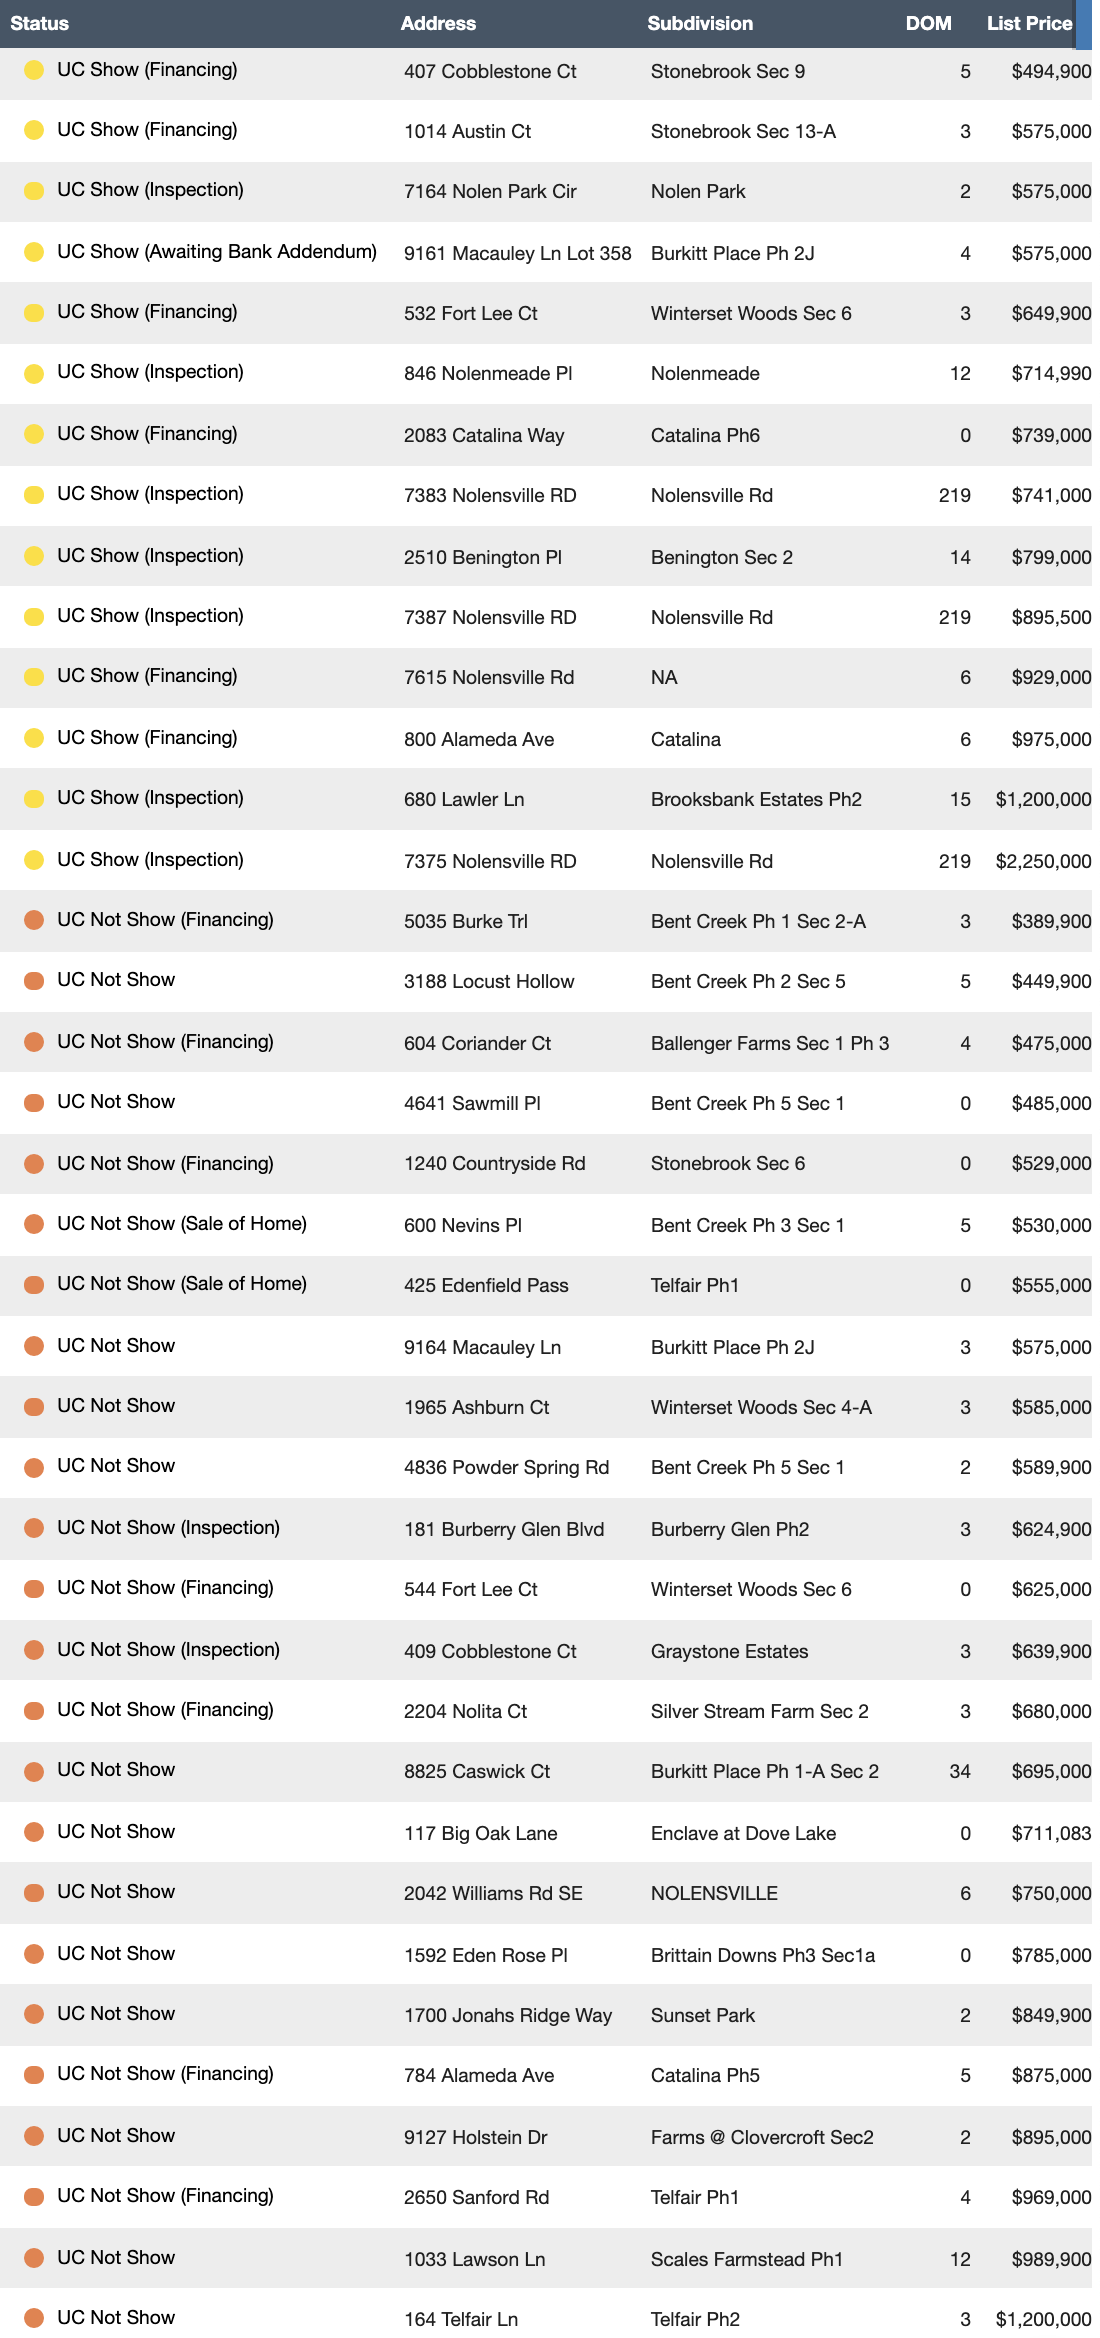
There are thirty-eight existing properties under contract in Nolensville (Williamson County) today. Excluding some larger-acreage properties and focusing only on subdivision resales illustrates an average days on market of six. This is down from seven in May.
In order for the market to balance, we’re going to need to see days on market move back up. Here’s a look at how the resale market has fared with days on market over the past decade:
2021 (year to date): 7 days on market | 103.02% Sales Price to List Price Ratio
2020: 19 days on market | 99.07% Sales Price to List Price Ratio
2019: 30 days on market | 98.4% Sales Price to List Price Ratio
2018: 30 days on market | 98.57% Sales Price to List Price Ratio
2017: 26 days on market | 98.63% Sales Price to List Price Ratio
2016: 33 days on market | 98.70% Sales Price to List Price Ratio
2015: 32 days on market | 98.40% Sales Price to List Price Ratio
2014: 36 days on market | 97.35% Sales Price to List Price Ratio
2013: 42 days on market | 97.64% Sales Price to List Price Ratio
2012: 57 days on market | 97.66% Sales Price to List Price Ratio
2011: 78 days on market | 96.87% Sales Price to List Price Ratio
*Note: The information above cites Williamson County sales data for Nolensville, Tennessee. There is, of course, a small percentage of Nolensville homes that exist in Davidson and Rutherford counties, but for continuity in my blogging I reference only Williamson County statistics.
Williamson County Home Sales Stats
This section will be updated once the Williamson County Association of REALTORS releases final sales data in the coming week.
Where Does It Go From Here?…
In years past we’d be looking at the peak number of homes available for sale right now. Today (7/6/2021), that number stands at a paltry twenty-three… eleven of them being new construction homes you can’t even move into any time soon.
That said, there are a handful of Nolensville homes sitting on the market right now… something we haven’t seen in months. Buyers may be approaching the limit of what they’re willing to give in order to get in a home. I’m already hearing about fewer showings and longer days on market in some other parts of Greater Nashville. Reality will set in again before long.
Keep an eye on those inflation numbers these next three months… they’ll likely inform us on what happens next in the housing market.
Interested in up to date Nolensville TN real estate sales figures? I’ll email you an HOURLY UPDATED look at Nolensville real estate activity including what has gone pending, price-reduced, and withdrawn. Just shoot me an email with your name and preferred email address to flint@theguidehome.com
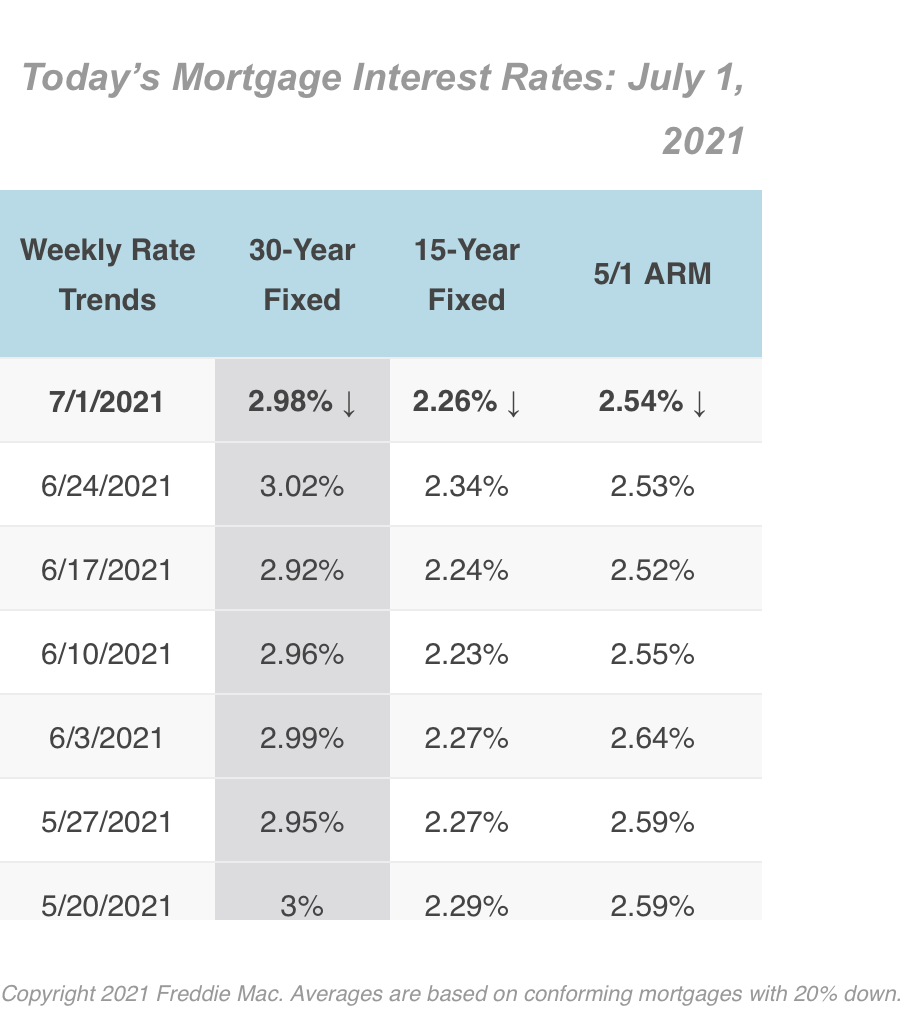
Mortgage Rates – 7/1/2021
This section courtesy of MyMortgageInsider.com –
The number of mortgage applications decreased last week, as reported by Mortgage Bankers Association. “Mortgage application volume fell to the lowest level in almost a year and a half, with declines in both refinance and purchase applications. Mortgage rates were volatile last week, as investors tried to gauge upcoming moves by the Federal Reserve amidst several divergent signals, including rising inflation, mixed job market data, strong consumer spending, and a supply-constrained housing market that has led to rapid home-price growth,” said Mike Fratantoni, MBA’s Senior Vice President and Chief Economist.
The interest rates reported below are from a weekly survey of 100+ lenders by Freddie Mac PMMS. These average rates are intended to give you a snapshot of overall market trends and may not reflect specific rates available for you.

Flint Adam is an 11- year Nolensville resident and lives with his wife and children in Bent Creek. He focuses his real estate practice here in town, having served more than 150 buyers and sellers in closed Nolensville real estate transactions. Flint enjoys blogging about local real estate, traveling the world, photography, and bourbon-hunting. He is passionate about serving Nolensville and keeping it one of America’s greatest small towns.