
by Flint Adam, Nolensville resident & REALTOR®
*Note: The information below cites Williamson County sales data for Nolensville, Tennessee. There is, of course, a small percentage of Nolensville homes that exist in Davidson and Rutherford counties, but for continuity in my blogging I reference only Williamson County statistics.
The Nolensville housing market looks a lot like the stock market right now: despite a global pandemic, social-distancing, job-losses, and uncertain months ahead, it remains surprisingly strong!
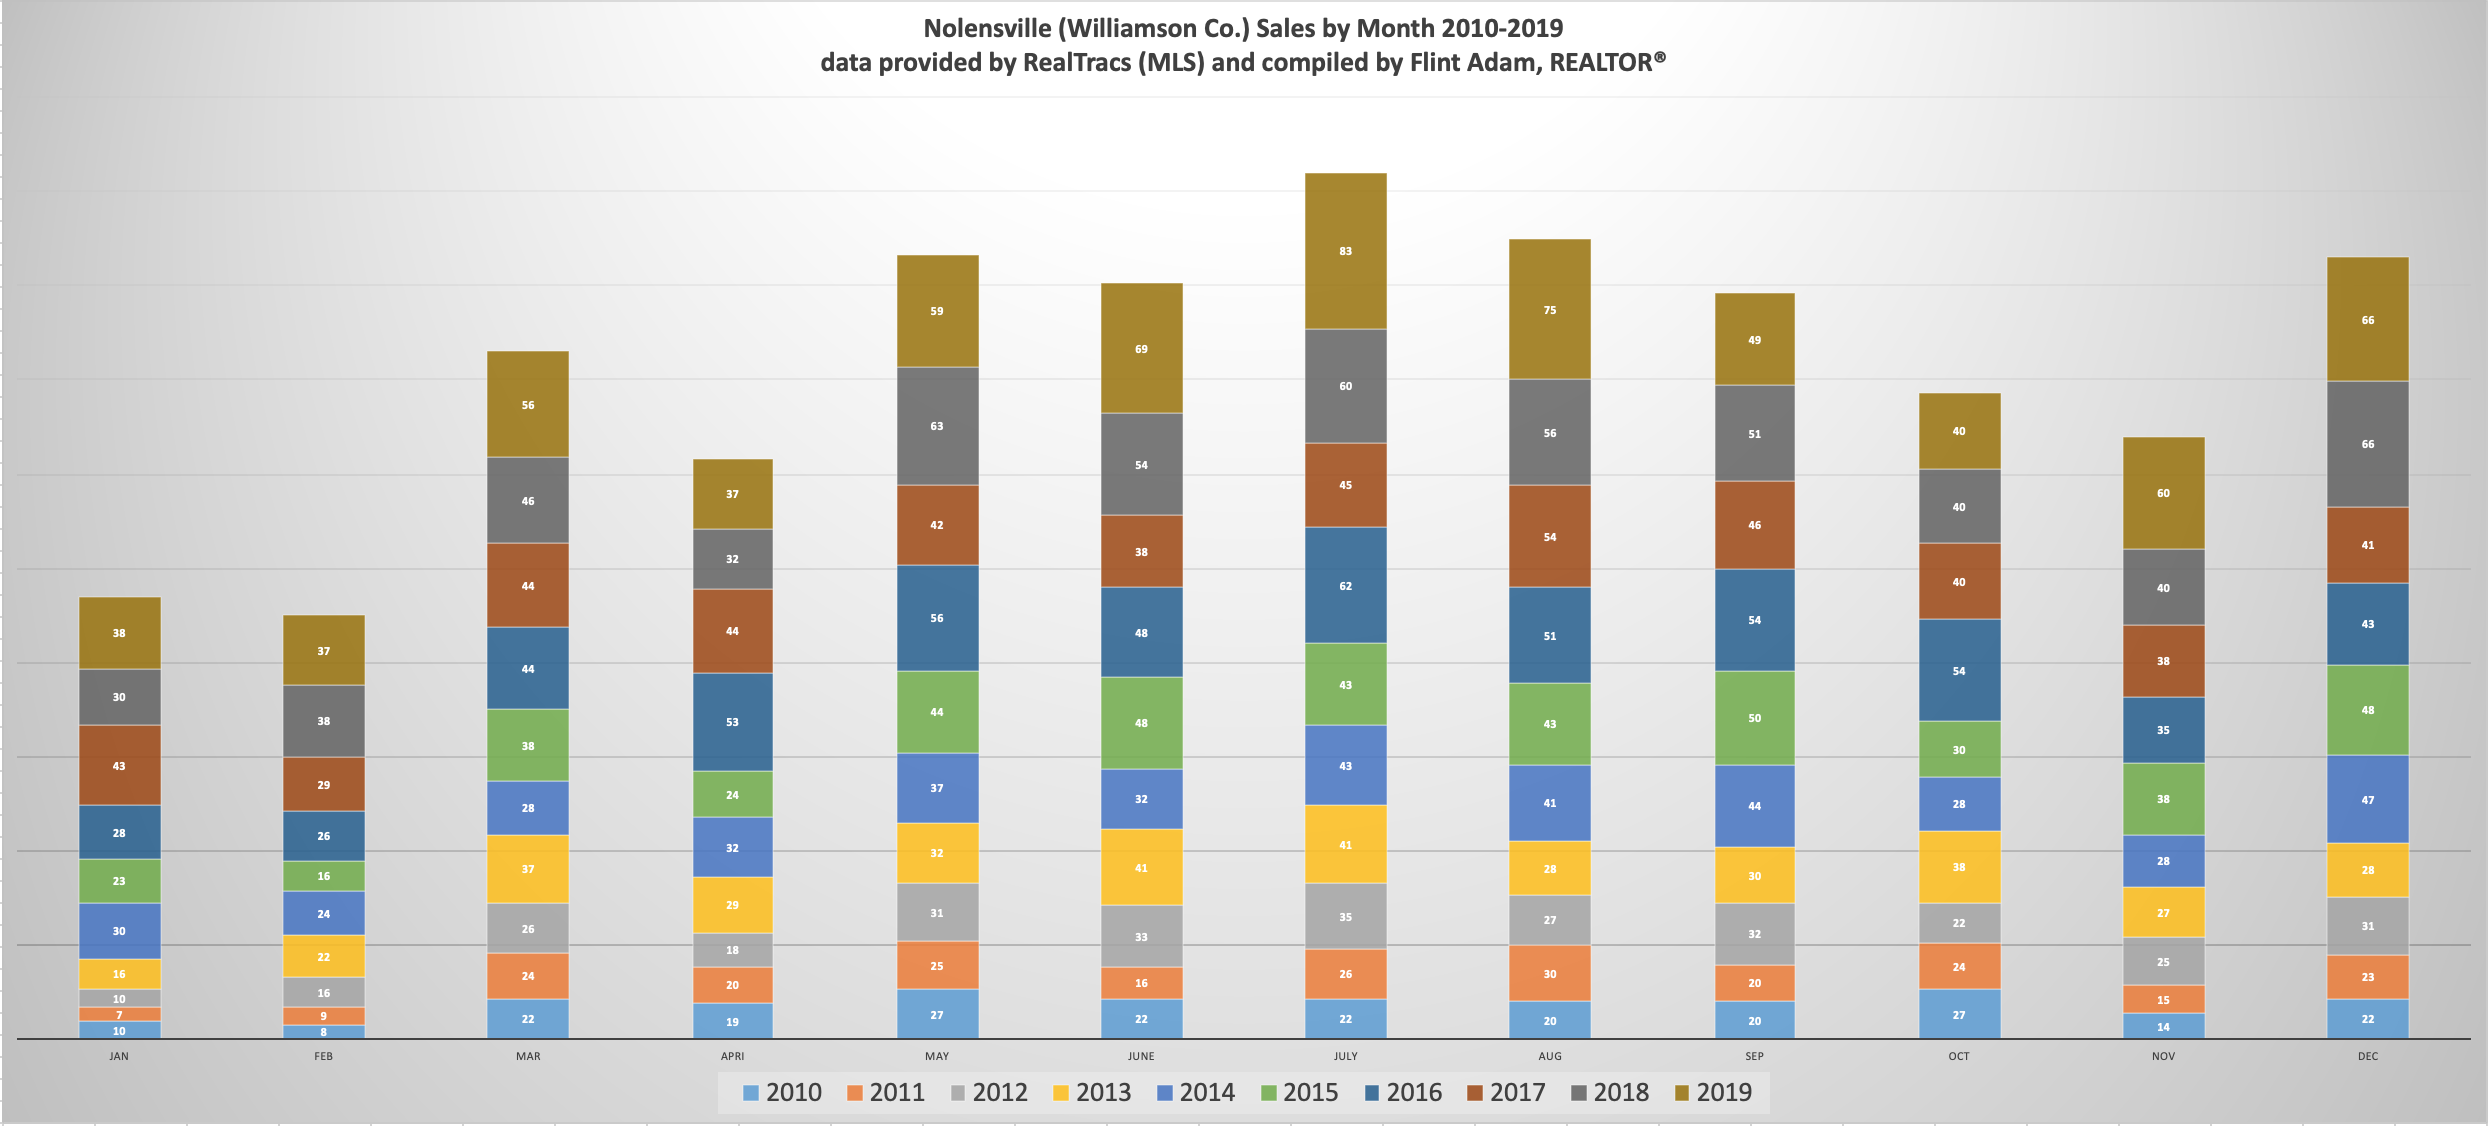
June 2020 Nolensville home sales were the second-best ever for the month (60 sales compared to the record-high of 69 set last year), and marked the eleventh time that at least sixty Nolensville homes closed in a month. Six other sixty-sale months have occurred in just the past year and a half.
June 2020 sales stats vs. June 2019:
*note: my Nolensville stats will be revised once the Williamson County Association of REALTORS releases its official numbers in the coming days.
- 60 Nolensville homes sold… down from 69 (-13.04%)
- The average sales price was $584,035… up from $543,827 (+7.39%)
- The average days on market was 26… up from 25 (+4%)
- The list-price-to-sales-price ratio was 99.87%… up from 99.31% (+0.56%)
- 27 of the 60 homes (%) sold were new construction
- The highest price sale was 828 Delamotte Pass in Telfair. for $1,022,185.
- The lowest price sale was 818 Cottage House Ln. in Nolen Mill for $329,490
One of the remarkable aspects of Nolensville real estate this year has been the strong list-price-to-sales-price ratios we’ve seen.
The list-price-to-sales-price ratio is one of the data points REALTORS® comb through in understanding the market’s flow. It measures the list (or asking) price of a home vs. the price it eventually sells for. A home listed for $500,000 that sells for $490,000 will have a list-to-sales-price ratio of 98%.
This year’s numbers have been strong across the board:
- June 2020 – 99.87%
- May 2020 – 99.62%
- April 2020 – 99.48%
- March 2020 – 99.92%
- February 2020 – 99.53%
- January 2020 – 100.14%
These figures, above, are for all Nolensville (Williamson Co.) home sales, but new construction does skew the numbers upward. So, let’s look at these figures in only the Nolensville (Williamson Co.) resale market:
- June 2020 – 99.04% (-0.83%)
- May 2020 – 98.82% (-0.80%)
- April 2020 – 98.72% (-0.76%)
- March 2020 – 99.33% (-0.59%)
- February 2020 – 98.61% (-0.92%)
- January 2020 – 98.45% (-1.65%)
Still strong, even when eliminating new construction from the formula. I saw it in my own business – I had six straight Nolensville listings sell for full asking price this spring. I can’t remember that ever happening before.
June 2020 Sales by Nolensville Neighborhood
*Click the neighborhood to pull the closed MLS reports. Links are only good for 30 days from original publication of this blog.
Note: average price per square foot has a lot of factors that go in to it, and should not be considered an authoritative source for pricing your own home. Want to understand why? Call me at 615-500-6393 and let’s talk.
- Arrington Retreat: 1 – avg. selling price/sf = $177.33
- Belvedere: 1 – avg. selling price/sf = $159.49
- Benington: 3 – avg. selling price/sf = $185.42
- Bent Creek: 9 – avg. selling price/sf = $170.12
- Brittain Downs: 2 – avg. selling price/sf = $187.40
- Brooksbank Estates: 1 – avg. selling price/sf = $218.02
- Burberry Glen: 5 – avg. selling price/sf = $181.27
- Burkitt Place: 4 – avg. selling price/sf = $164.04
- Catalina: 3 – avg. selling price/sf = $160.04
- Hadley Reserve: 1 – avg. selling price/sf = $236.02
- Nolen Mill: 3 – avg. selling price/sf = $196.68
- Nolen Park: 2 – avg. selling price/sf = $143.00
- Scales Farmstead: 8 – avg. selling price/sf = $186.01
- Silver Stream: 2 – avg. selling price/sf = $156.21
- Stonebrook: 1 – avg. selling price/sf = $197.50
- Summerlyn: 5 – avg. selling price/sf = $183.07
- Sunset Park: 1 – avg. selling price/sf = $175.59
- Telfair: 3 – avg. selling price/sf = $211.00
- Winterset Woods: 1 – avg. selling price/sf = $176.73
- The Woods at Burberry Glen: 1 – avg. selling price/sf = $191.57
- Non-Neighborhood Homes Sold: 3
Williamson County Home Sales Stats
This section will be updated once the Williamson County Association of REALTORS releases final June sales stats in the coming days.
Interested in up to date Nolensville TN real estate sales figures? I’ll email you an HOURLY UPDATED look at Nolensville real estate activity including what has gone pending, price-reduced, and withdrawn. Just shoot me an email with your name and preferred email address to flint@theguidehome.com
July 2020 Outlook
We’re now in what is typically the peak month of real estate sales in Nolensville, with August a close second.
There are currently 57 Nolensville resales that went under contract by June 30th, and based on a typical 30-day closing timeline, should make for a very busy July. Throw in new construction sales and we should have another strong month of real estate ahead of us.
Can it break last year’s record of 83 sales in July? (This is also the record for any month of the year in Nolensville). That remains to be seen, but we certainly have a path to one of the strongest sales months ever recorded in town.
Meanwhile, long-term mortgage rates hit their lowest level EVER last week. While inventory could be better, this remains an excellent time to buy a home.
Mortgage Rates…
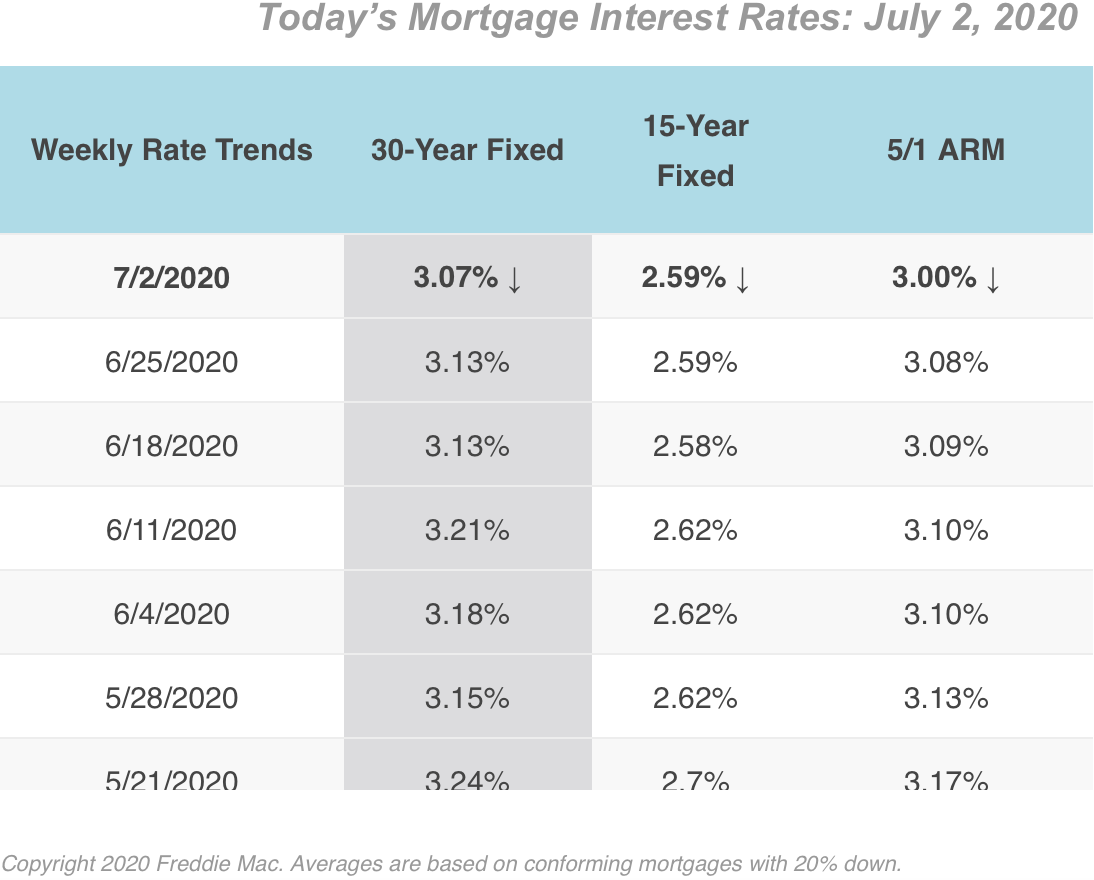
From My Mortgage Insider.com: “
Mortgage application volume dropped this week despite record low rates, as reported by Mortgage Bankers Association. “Mortgage applications fell last week despite mortgage rates hitting another record low in MBA’s survey. Investors are contemplating the risks of the recent resurgence of COVID-19 cases to the labor market and economy, and Treasury rates and mortgage rates are moving lower as a result,” said Joel Kan, MBA Associate Vice President of Economic and Industry Forecasting.
The interest rates reported below are from a weekly survey of 100+ lenders by Freddie Mac PMMS. These average rates are intended to give you a snapshot of overall market trends and may not reflect specific rates available for you.
My Nolensville Friends & Neighbors Served In 2020…
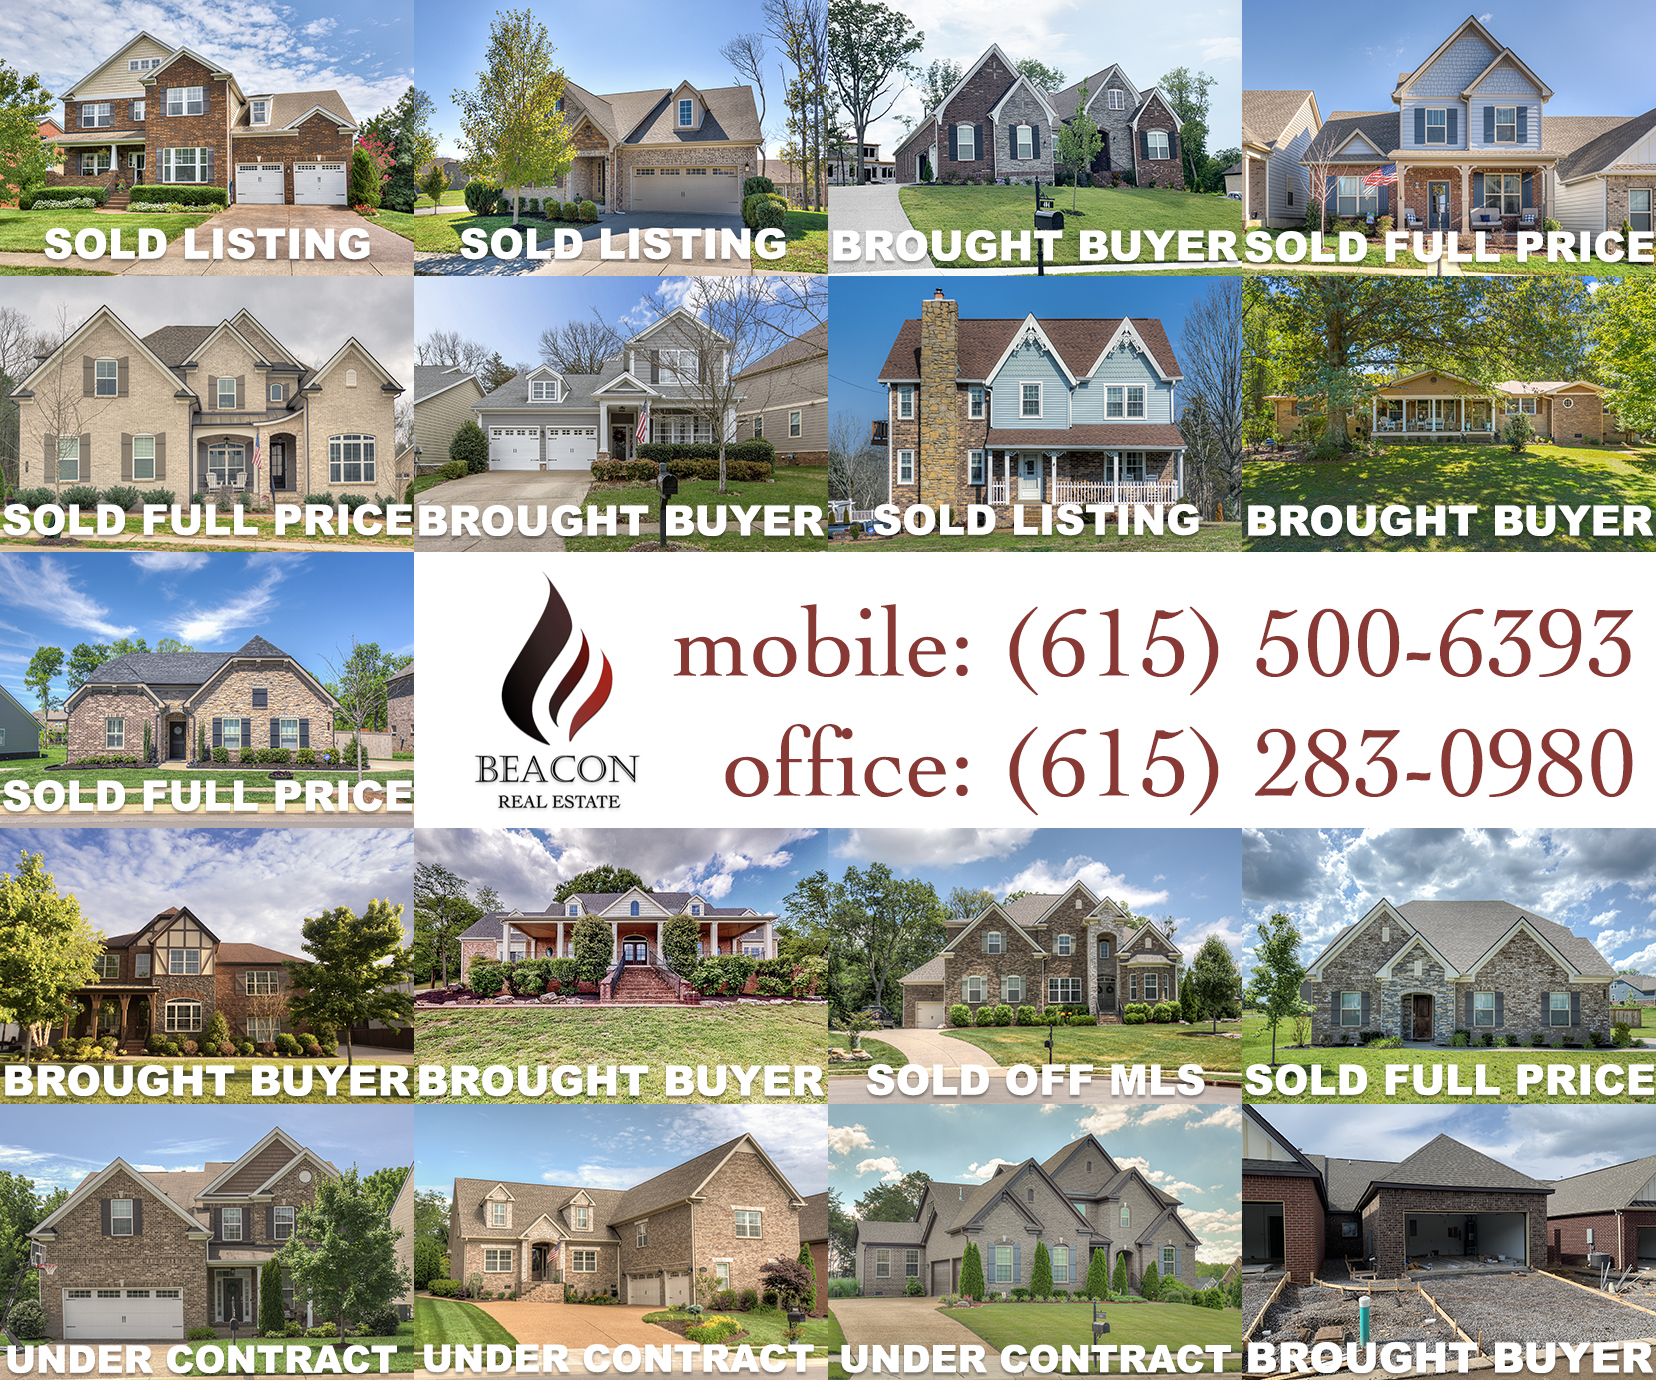
It is an honor serving my Nolensville friends and neighbors. This year, I’m blessed to have worked with 17 families and counting. If you are considering buying or selling real estate here in Nolensville, or around Greater Nashville, it would be my honor to receive your call.
I’m a Nolensville TN resident… I’m a Nolensville TN Realtor®… and I always offer a complimentary, no commitment, no pressure Comparative Market Analysis for my neighbors. Please let me know how I may assist you in the sale or purchase of a Nolensville property.