

by Flint Adam, Nolensville resident & REALTOR®
*Note: The information below cites Williamson County sales data for Nolensville, Tennessee. There is, of course, a small percentage of Nolensville homes that exist in Davidson and Rutherford counties, but for continuity in my blogging I reference only Williamson County statistics.
October has become as consistent a month of sales in Nolensville as you could ask for. For the fourth straight year, Nolensville (Williamson County) residential sales hit either 40 or 41 homes closed.
What *has* changed, however, is the average sales price during that time. Last month, it cost an average $603,832 to buy a home in Nolensville. It was “only” $507,424 in 2017.
That’s a $96,408 jump in three years, but buyers will be relieved to see that prices have stabilized over the past year.
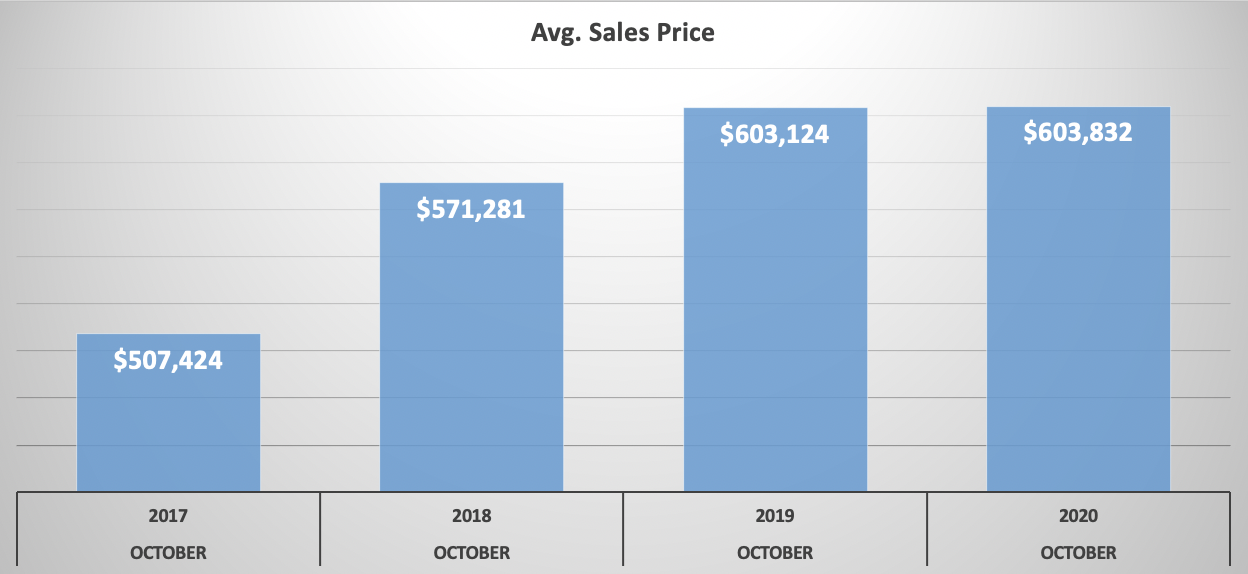
The biggest jump in Nolensville home prices occurred between 2017 and 2018. You may remember that 2017 was the year Williamson County began implementing a school impact fee on all new construction. This was a significant add-on in the marketplace because 56% of all Nolensville homes sold these past four years have been new construction.
The fee is calculated by the liveable square footage of a newly built home, and it averages out to a little more than $10,000 on the typical Nolensville new build.
Half of the total impact fee was priced into new construction beginning March 2017, and the full amount rolled out September 2017. It would be months later, though, before we began seeing the effect on closing prices as new construction typically takes six to eight months to complete.
The school impact fee isn’t the only thing responsible for the significant jump in Nolensville home prices. Material costs have gone up, land-acquisition and development costs keep rising, labor prices hiked as demand soared, and builders began building larger, nicer homes around town.
October 2020 Recap…
On to the details… the Nolensville real estate market flattened out after its record-setting September.
Part of this is simply October consistency: in five out of the past ten Octobers, 38 to 41 homes sold in Nolensville. The market tends to exhale after the summer rush, and this year is no exception.
Add in a presidential election and worldwide pandemic, and it’s possible that some buyers are taking a moment to see what happens before returning to the fold.
October 2020 sales stats vs. October 2019:
- 41 Nolensville homes sold… one more than a year ago (+2.5%)
- The average sales price was $603,832… up from $603,124 (+0.12%)
- The average days on market was 26… down from 32 (-6 days)
- The list-price-to-sales-price ratio was 100.6%… up from 100.1% (+.50%)
- 20 of the 41 homes (49%) sold were new construction
- The lowest price sale was 858 Stonebrook Blvd. for $363,000.
- The highest price sale was 259 Beglian Road in Benington for $1,171,415
October 2020 Sales by Nolensville Neighborhood:
Note: average price per square foot has a lot of factors that go in to it, and should not be considered an authoritative source for pricing your own home. Want to understand why? Call me at 615-500-6393 and let’s talk.
- Arrington Retreat: 1 – avg. selling price/sf = $195
- Ballenger Farms: 3 – avg. selling price/sf = $160
- Belvedere Estates: 1 – avg. selling price/sf = $182
- Benington: 2 – avg. selling price/sf = $191
- Bent Creek: 2 – avg. selling price/sf = $157
- Burberry Glen: 4 – avg. selling price/sf = $182
- Burkitt Place: 2 – avg. selling price/sf = $157
- Catalina: 4 – avg. selling price/sf = $182
- Enclave at Dove Lake: 1 – avg. selling price/sf = $203
- Farm at Clovercroft: 1 – avg. selling price/sf = $194
- Gilchrist South: 1 – avg. selling price/sf = $192
- McFarlin Woods: 2 – avg. selling price/sf = $184
- Nolen Park: 1 – avg. selling price/sf = $163
- Scales Farmstead: 3 – avg. selling price/sf = $213
- Silver Stream: 2 – avg. selling price/sf = $163
- Stonebrook: 2 – avg. selling price/sf = $200
- Summerlyn: 2 – avg. selling price/sf = $170
- Telfair: 3 – avg. selling price/sf = $214
- The Woods at Burberry Glen: 2 – avg. selling price/sf = $178
- Non-Neighborhood Homes Sold: 1
Williamson County Home Sales Stats
This section will be updated when the Williamson County Association of REALTORS releases final sales stats in a few days.
Where Does It Go From Here…
I’m not seeing as many locals move around town as I did a few years ago. The “Nolensville shuffle” was a primary driver of new construction sales three to five years ago. Now, I’m seeing a lot of growth come from families relocating from California, Illinois, New York, and Texas… states with high property taxes.
I believe low interest rates, Tennessee’s favorable climate and taxes, quality of life and cost of living will continue driving growth in the fourth quarter despite the uncertainties of our presidential election and worldwide pandemic.
There are 48 Nolensville resales currently under contract, and a host of new construction, too. This should make for a pretty robust November, and once the dust settles with the election, I bet we get a little more traction to close out the year.
Interested in up to date Nolensville TN real estate sales figures? I’ll email you an HOURLY UPDATED look at Nolensville real estate activity including what has gone pending, price-reduced, and withdrawn. Just shoot me an email with your name and preferred email address to flint@theguidehome.com
Mortgage Rates…
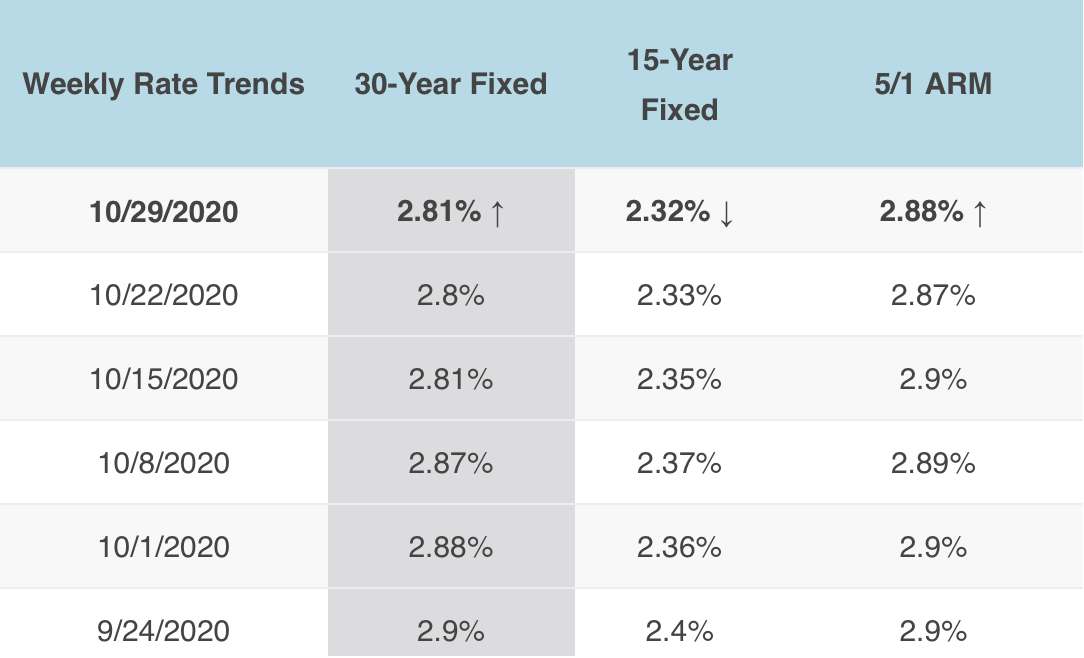
From My Mortgage Insider.com: “
Mortgage applications decreased this week, as reported by Mortgage Bankers Association. “Refinance activity has been somewhat volatile over the past few months but did increase almost 3 percent last week,” said Joel Kan, MBA Associate Vice President of Economic and Industry Forecasting.
The interest rates reported below are from a weekly survey of 100+ lenders by Freddie Mac PMMS. These average rates are intended to give you a snapshot of overall market trends and may not reflect specific rates available for you.
I’m a Nolensville TN resident… I’m an award-winning, Nolensville TN Realtor®… and I always offer a complimentary, no commitment, no pressure Comparative Market Analysis for my neighbors. Please let me know how I may assist you in the sale or purchase of a Nolensville property.