

by Flint Adam, Nolensville resident & REALTOR®
(UPDATE: Williamson County sales stats added below on Friday, June 11, 2021)
Would-be home buyers looking in and around Nolensville are stuck in a hellish reproduction of the 1993 Bill Murray film, Groundhog Day. In this dark comedy, though, the events repeat weekly.
 Each Thursday and Friday, a smattering of homes hit the market. Like piranhas on the bone, buyers gather ’round in a frenzied display of determination and desperation. But alas, there can be only one. By Monday, one buyer claims victory while the rest slink back to lick their wounds and plot their efforts for the weekend ahead.
This, folks, is real estate today.
The headlines keep touting record-low inventory, which is true, but January through May 2021 residential sales have fallen only 13.58% off of last year’s record-setting pace. This year’s sales are, in fact, virtually identical with January through May production from 2018. That is hardly anything to sneeze at.
 The big difference between now and then is that very little fails to sell. With little to no carryover inventory week to week, it keeps buyers hungry and poised to make aggressive bids when new product hits the market.
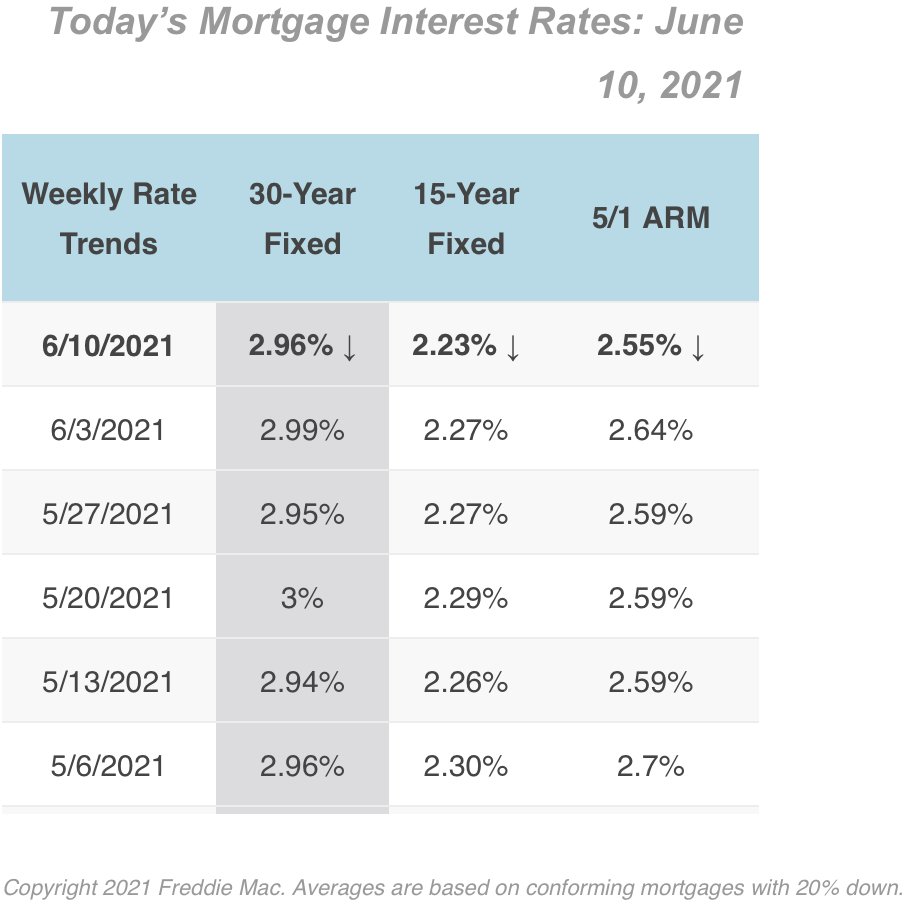
Low interest rates remain a driving force. Three years ago the average 30-year fixed mortgage-rate was 4.66%. Last week, it hovered around 2.95%.
There is also the proliferation of people moving here from out of state. Former Chicagoans have been pouring into Middle Tennessee for years, but now Californians, tired of extreme taxes and regulation, are practicing their yee-haws and throwing elbows at anybody else vying for a home.
To win in today’s marketplace, it often takes extreme offers that eliminate inspections, appraisals, and whatever else a buyer can think of. That’s all before you get to the final price, and oh boy – some of last month’s are eye-popping:
- 2424 Trivaca Lane – list price: $489,900 | selling price: $540,000
- 2728 Cortlandt Lane – list price: $520,000 | selling price: $571,000
- 5043 Aunt Nannies Place – list price: $589,900 | selling price: $676,000
- 1221 Bradshaw Lane – list price: $679,900 | selling price: $735,000
- 405 Pastoral Way – list price: $699,900 | selling price: $763,500
All told, the average Nolensville resale sold at 4.46% above asking-price last month. In dollars and cents, that averaged out to a cool $26,168 in gravy. Who’s hungry?
May 2021 sales stats vs. May 2020:
(Sales Data is for Williamson County Nolensville only. This will be revised once the Williamson County Association of REALTORS releases final stats in about a week.)
- 42 Nolensville (Williamson Co.) homes sold… down from 51 (-17.65%)
- The average sales price was $674,872… up from $601,225 (+12.24%)
- The average days on market was 12… down from 34 (-22 days)
- The list-price-to-sales-price ratio was 102.37%… up from 99.62% (+2.76%)
- 20 of the 42 homes (48%) sold were new construction
- The lowest price sale was 512 Meadow Creek Ln. in Stonebrook for $362,000.
- The highest price sale was 2000 Autry Dr. in Scales Farmstead for $1,121,800.
And here are some of the crazy facts:
- When we eliminate new construction and larger acreage properties and look solely at subdivision resales (21 total), some extraordinary figures come to light:
- The average sales-price to list-price ratio grows to 104.64%
- 17 of the 21 sales (81%) are above asking-price… anywhere from $6,000 to $86,100
- The average overage of the above-asking price sales is $34,629
- All-cash purchases make up 14% of sales
- The average days on market falls to 3
- Only 2 of 21 resales had a contract fall through before selling
- Only 1 of 21 resales had to price-reduce before going under contract
Contracts falling through are a part of real estate, but this is a figure I’m keeping an eye on. I’m aware of stories in other real estate markets where a higher percentage of contracts are falling through now that buyers are, in some cases, making sight-unseen offers. 2 out of 21 may not sound like much, but that’s about 10%. It’s quite possible we see this number eek higher in the coming months.
And despite multiple and above-asking price offers, it’s still possible that a listing may hit the market overpriced. That happened to at least one listing last month, and I expect more of this in the coming months, too.
Nolensville PENDING Resales as of 6/3/2021…
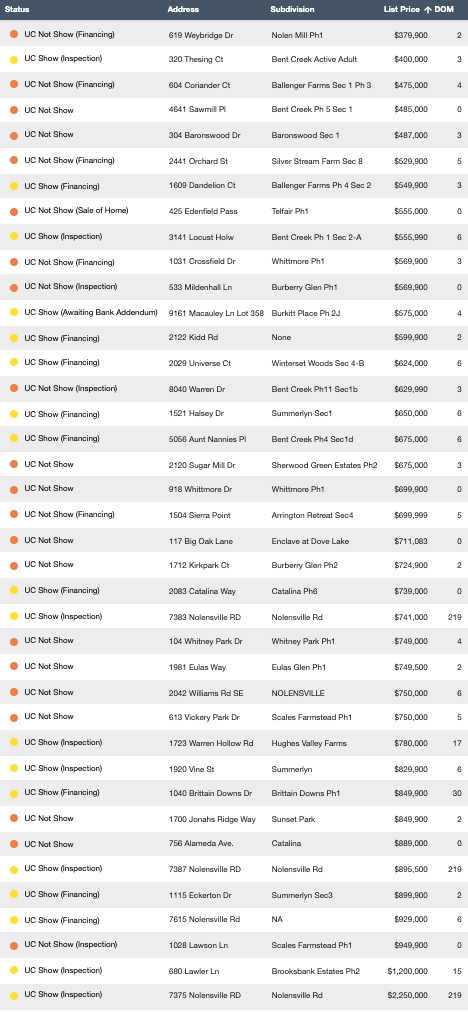
There are thirty-nine existing properties under contract in Nolensville (Williamson County) today. Excluding some larger-acreage properties and focusing only on subdivision resales illustrates an average days on market of seven. That’s actually up 133% from where we were in March, but it’s still extraordinarily low.
In order for the market to balance, we’re going to need to see days on market move back up. Here’s a look at how the resale market has fared with days on market over the past decade:
2021 (year to date): 7 days on market | 102.56% Sales Price to List Price Ratio
2020: 19 days on market | 99.07% Sales Price to List Price Ratio
2019: 30 days on market | 98.4% Sales Price to List Price Ratio
2018: 30 days on market | 98.57% Sales Price to List Price Ratio
2017: 26 days on market | 98.63% Sales Price to List Price Ratio
2016: 33 days on market | 98.70% Sales Price to List Price Ratio
2015: 32 days on market | 98.40% Sales Price to List Price Ratio
2014: 36 days on market | 97.35% Sales Price to List Price Ratio
2013: 42 days on market | 97.64% Sales Price to List Price Ratio
2012: 57 days on market | 97.66% Sales Price to List Price Ratio
2011: 78 days on market | 96.87% Sales Price to List Price Ratio
*Note: The information above cites Williamson County sales data for Nolensville, Tennessee. There is, of course, a small percentage of Nolensville homes that exist in Davidson and Rutherford counties, but for continuity in my blogging I reference only Williamson County statistics.
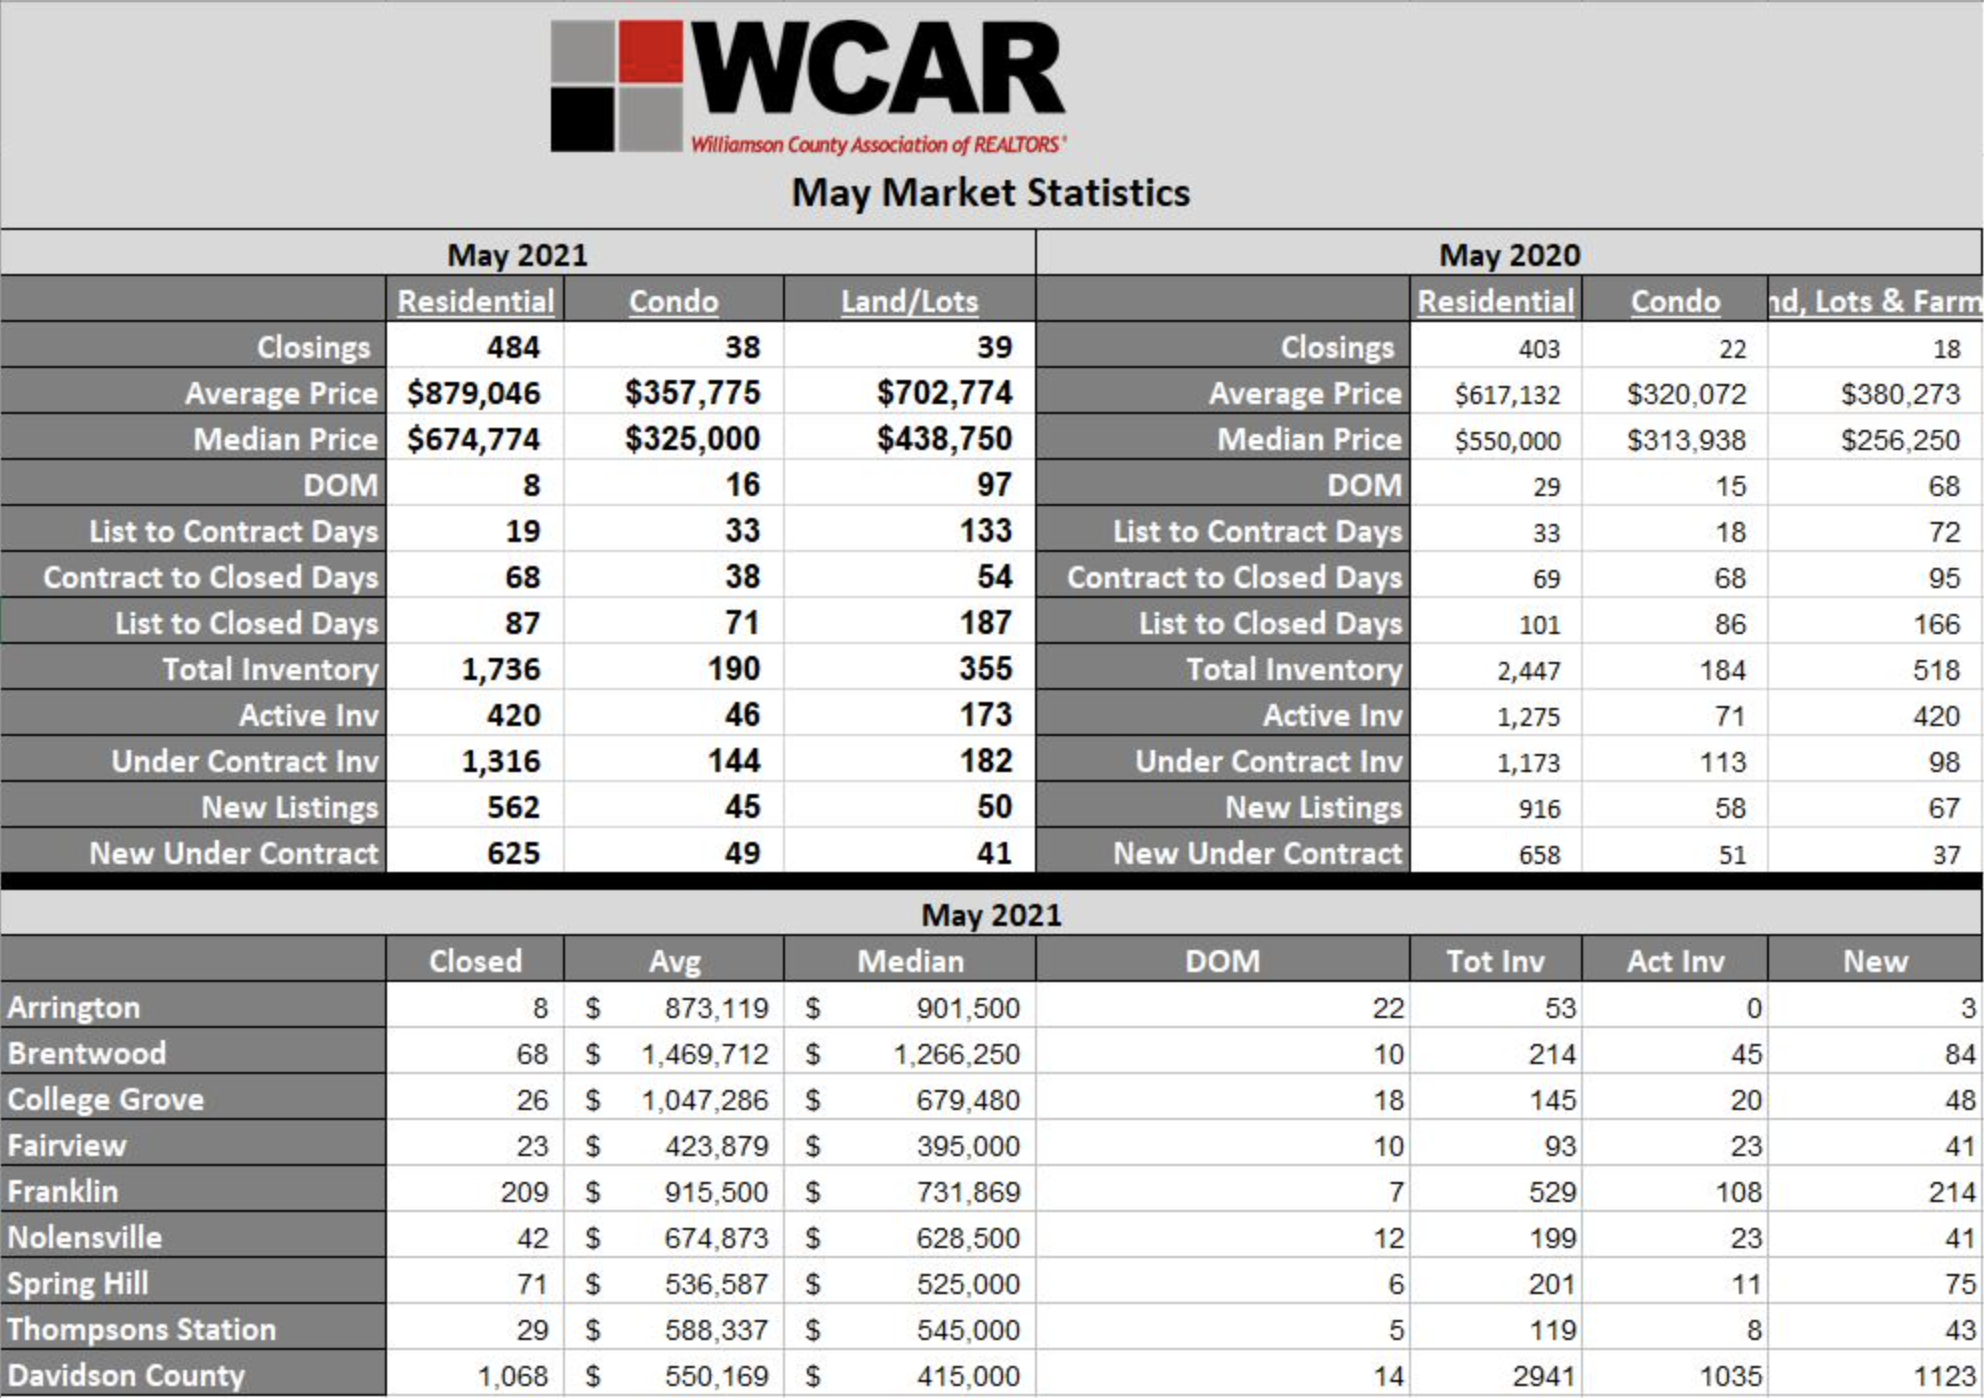
Williamson County Home Sales Stats
this section updated Friday, June 11, 2021
Williamson County as a whole saw remarkable year-over-year appreciation, with the average residence selling almost $262,000 higher than the same time a year ago. That’s a whopping 42% increase since last year!
The year-over-year change in median sales price isn’t quite as dramatic, though it’s still significant – rising 23%.
Average days on market plummeted from 29 last year to only 8 last month.
Active inventory, (the homes still available for purchase at month’s end), dropped by two-thirds, and new listings were down almost 40% from the year prior.
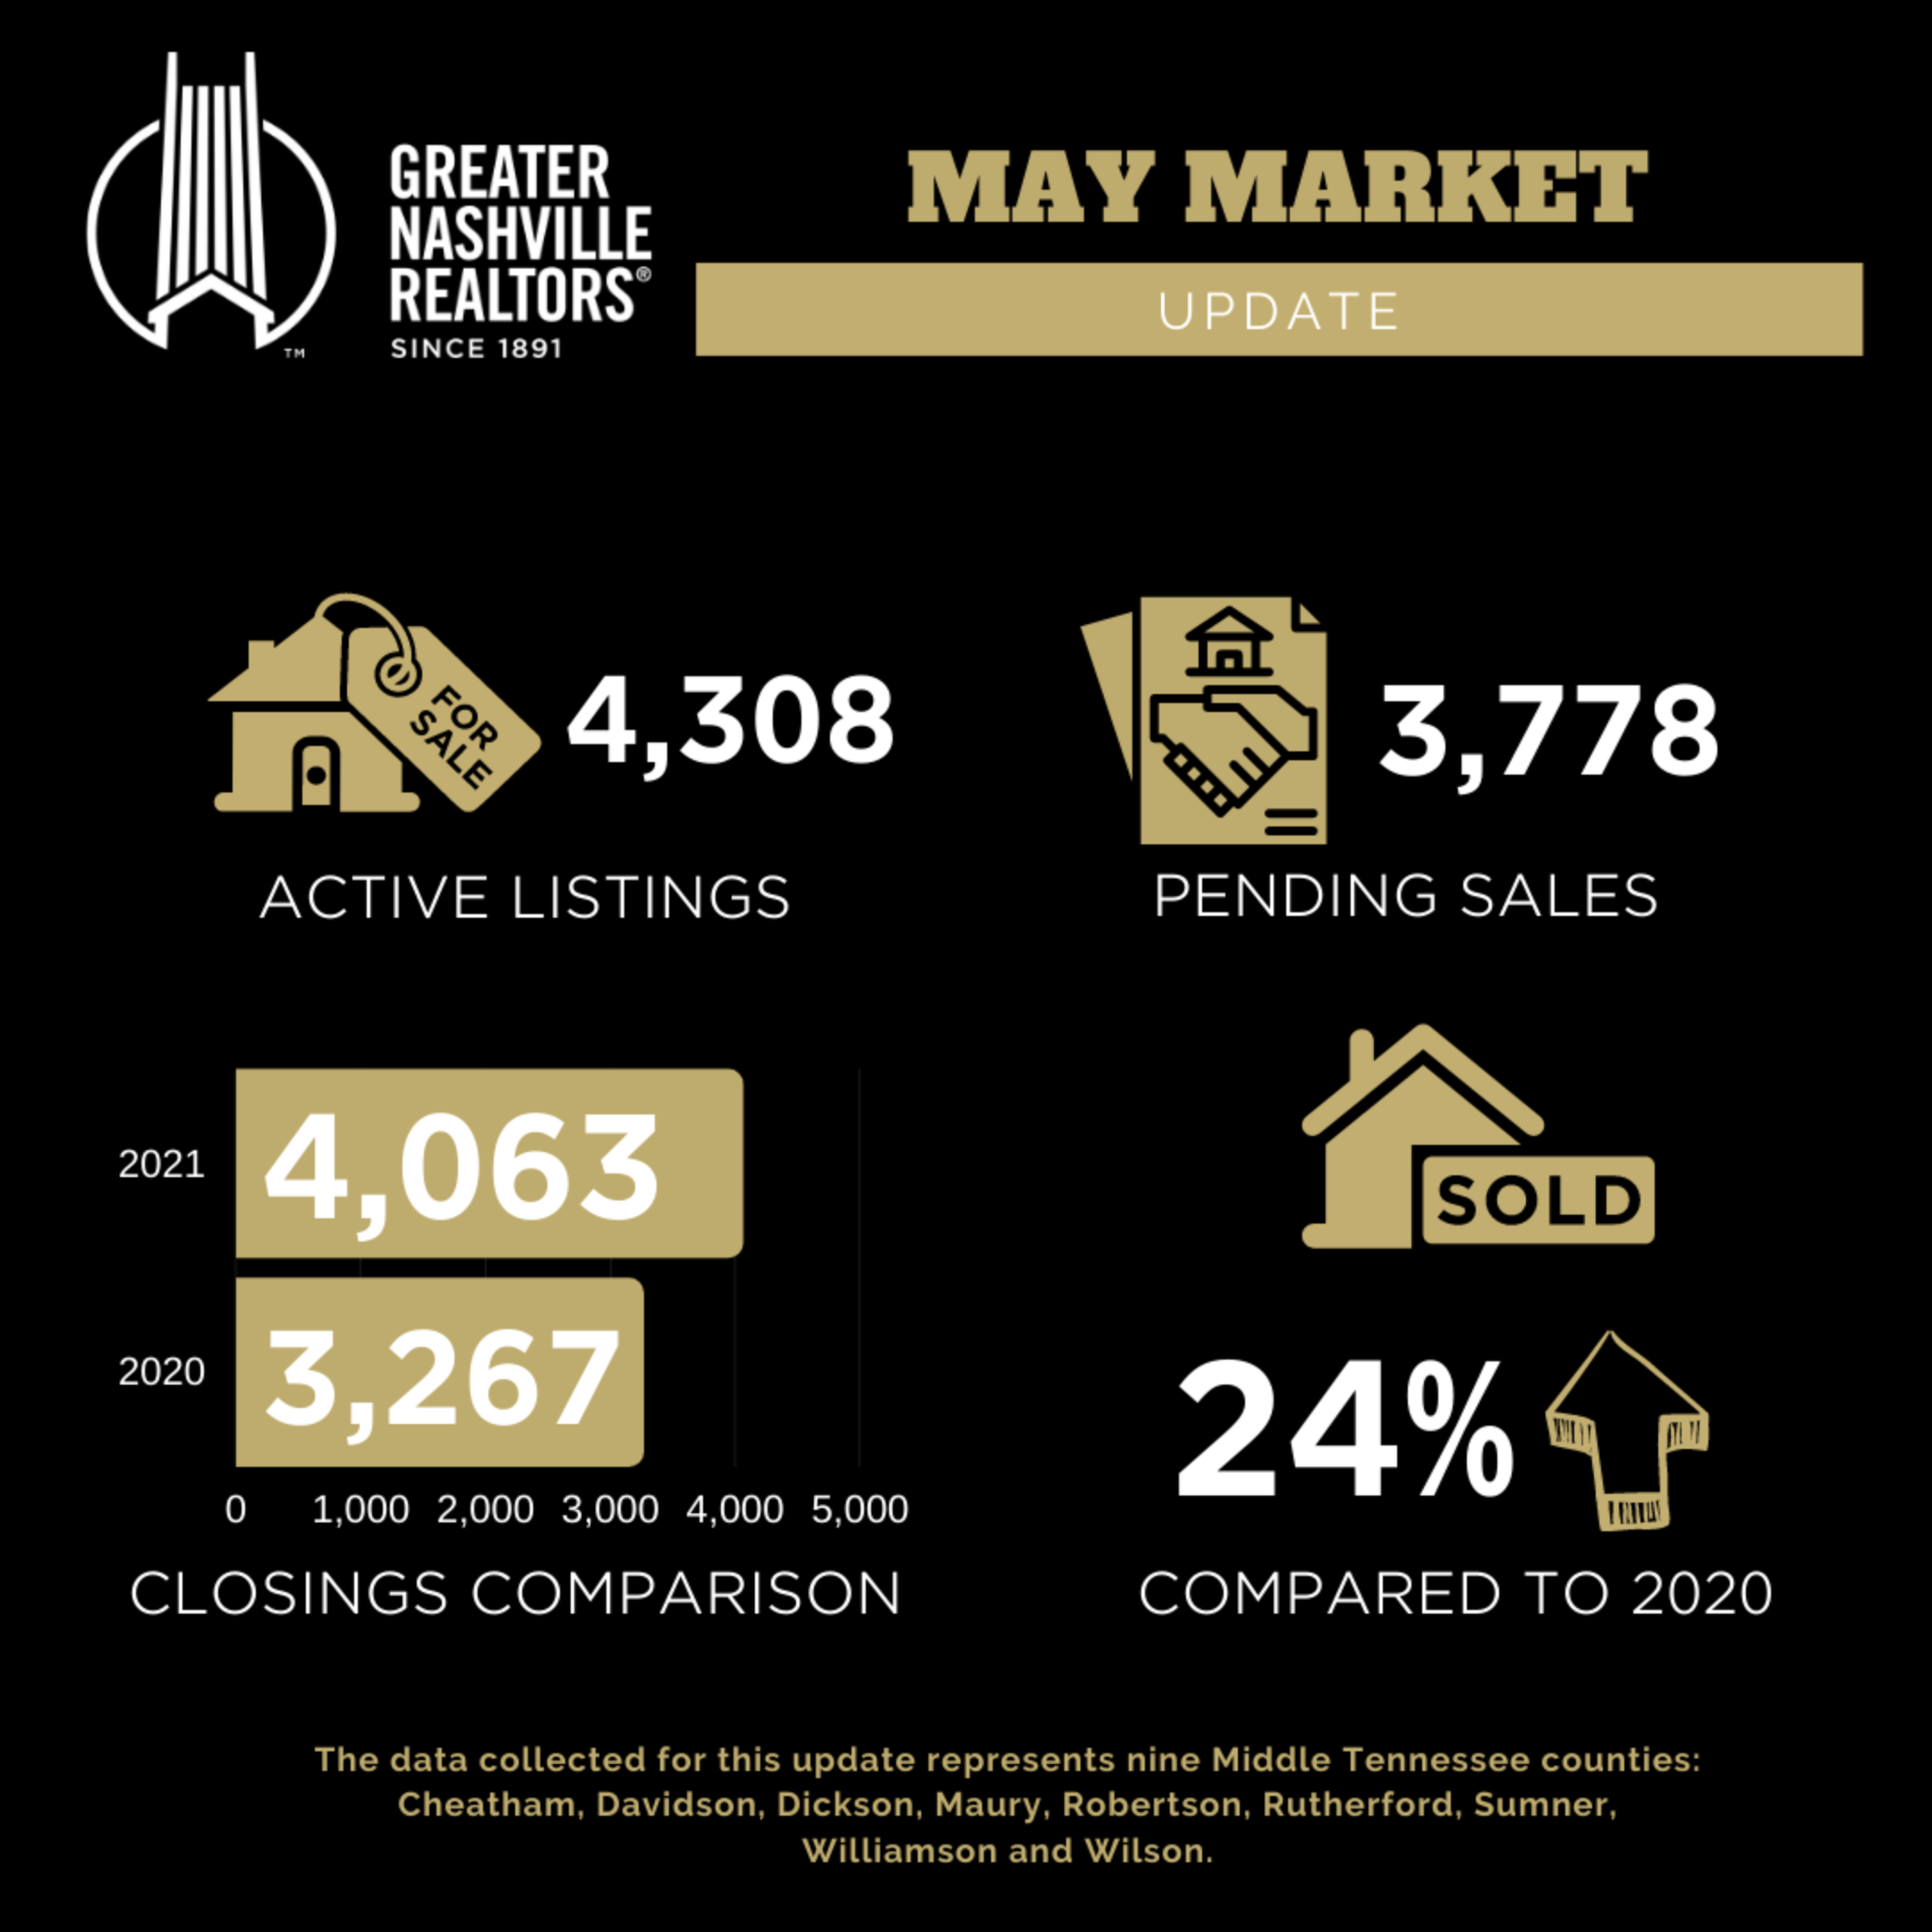
Greater Nashville Home Sales Stats
Where Does It Go From Here?…
Days on market are nudging up, but there remain too many buyers and too few homes for sale. The average above-asking sale-price has climbed about ten-grand since March, illustrating greater frenzy than where we were 60 days ago.
I keep expecting more inventory to hit the market now that we’re in summer, and folks are returning from vacations, but not enough has hit the market yet to make a real dent.
Interest rates have also remained low, despite concerns over inflation. Until they begin rising, I expect the feeding frenzy to continue.
Interested in up to date Nolensville TN real estate sales figures? I’ll email you an HOURLY UPDATED look at Nolensville real estate activity including what has gone pending, price-reduced, and withdrawn. Just shoot me an email with your name and preferred email address to flint@theguidehome.com
Mortgage Rates – 5/27/2021
This section courtesy of MyMortgageInsider.com –
The number of mortgage applications decreased last week, as reported by Mortgage Bankers Association. “Purchase applications were up slightly last week, and the large annual decline was the result of Memorial Day 2021 being compared to a non-holiday week, as well as the big upswing in applications seen last May once pandemic-induced lockdowns started to lift,” said Joel Kan, MBA Associate Vice President of Economic and Industry Forecasting. He noted an increase in both refinance and purchase activity.
The interest rates reported below are from a weekly survey of 100+ lenders by Freddie Mac PMMS. These average rates are intended to give you a snapshot of overall market trends and may not reflect specific rates available for you.

Flint Adam is an 11- year Nolensville resident and lives with his wife and children in Bent Creek. He focuses his real estate practice here in town, having served more than 150 buyers and sellers in closed Nolensville real estate transactions. Flint enjoys blogging about local real estate, traveling the world, photography, and bourbon-hunting. He is passionate about serving Nolensville and keeping it one of America’s greatest small towns.