
by Flint Adam, Nolensville resident & REALTOR®
*UPDATED 2/9/2022 with final January sales data provided by the Williamson County Association of REALTORS® and including local sales data not available at time of original publishing. (Original blog date was 2/3/2022). Revisions are noted with a cross-through. All sales figures mentioned below are from Williamson County Nolensville.
On January 31, 2020, I celebrated my 40th birthday party. Man, I was on top of the world – in really good shape, starting a new decade, the brokerage I founded, Beacon Real Estate, had just celebrated its first year of operations, and the Greater Nashville real estate market was humming along at an incredible pace.
During January 2020, Nolensville (Williamson County) set a record for the month with 53 homes closed. Compare that to three years earlier, when there was but one month in all of 2017 that had as many sales: 54 in August. So yeah, the world was cruising along, the economy was full steam ahead, and we were all excited about what the 2020s had in store.
Then a few weeks later, COVID-19 entered the worldwide lexicon.
Fast forward two years and we have navigated a pandemic that seemingly drags on and on. Some of its wider effects were extreme supply chain disruption, trillions of dollars of Federal stimulus, a redrawing of how and where people work, and a frenzied push to reimagine “home” for many families.
To the surprise and delight of many in my industry, real estate absolutely boomed as the world adjusted to COVID-19. But, the perfect storm of historically low interest rates and increasingly low housing inventory would push prices into the stratosphere during 2021.
Aggressive bidding and multiple offers became the norm, and what began as a little bit above asking-price sales in January/February 2021, became very aggressive in the spring with buyers paying more than 4% above asking-price in May and June.
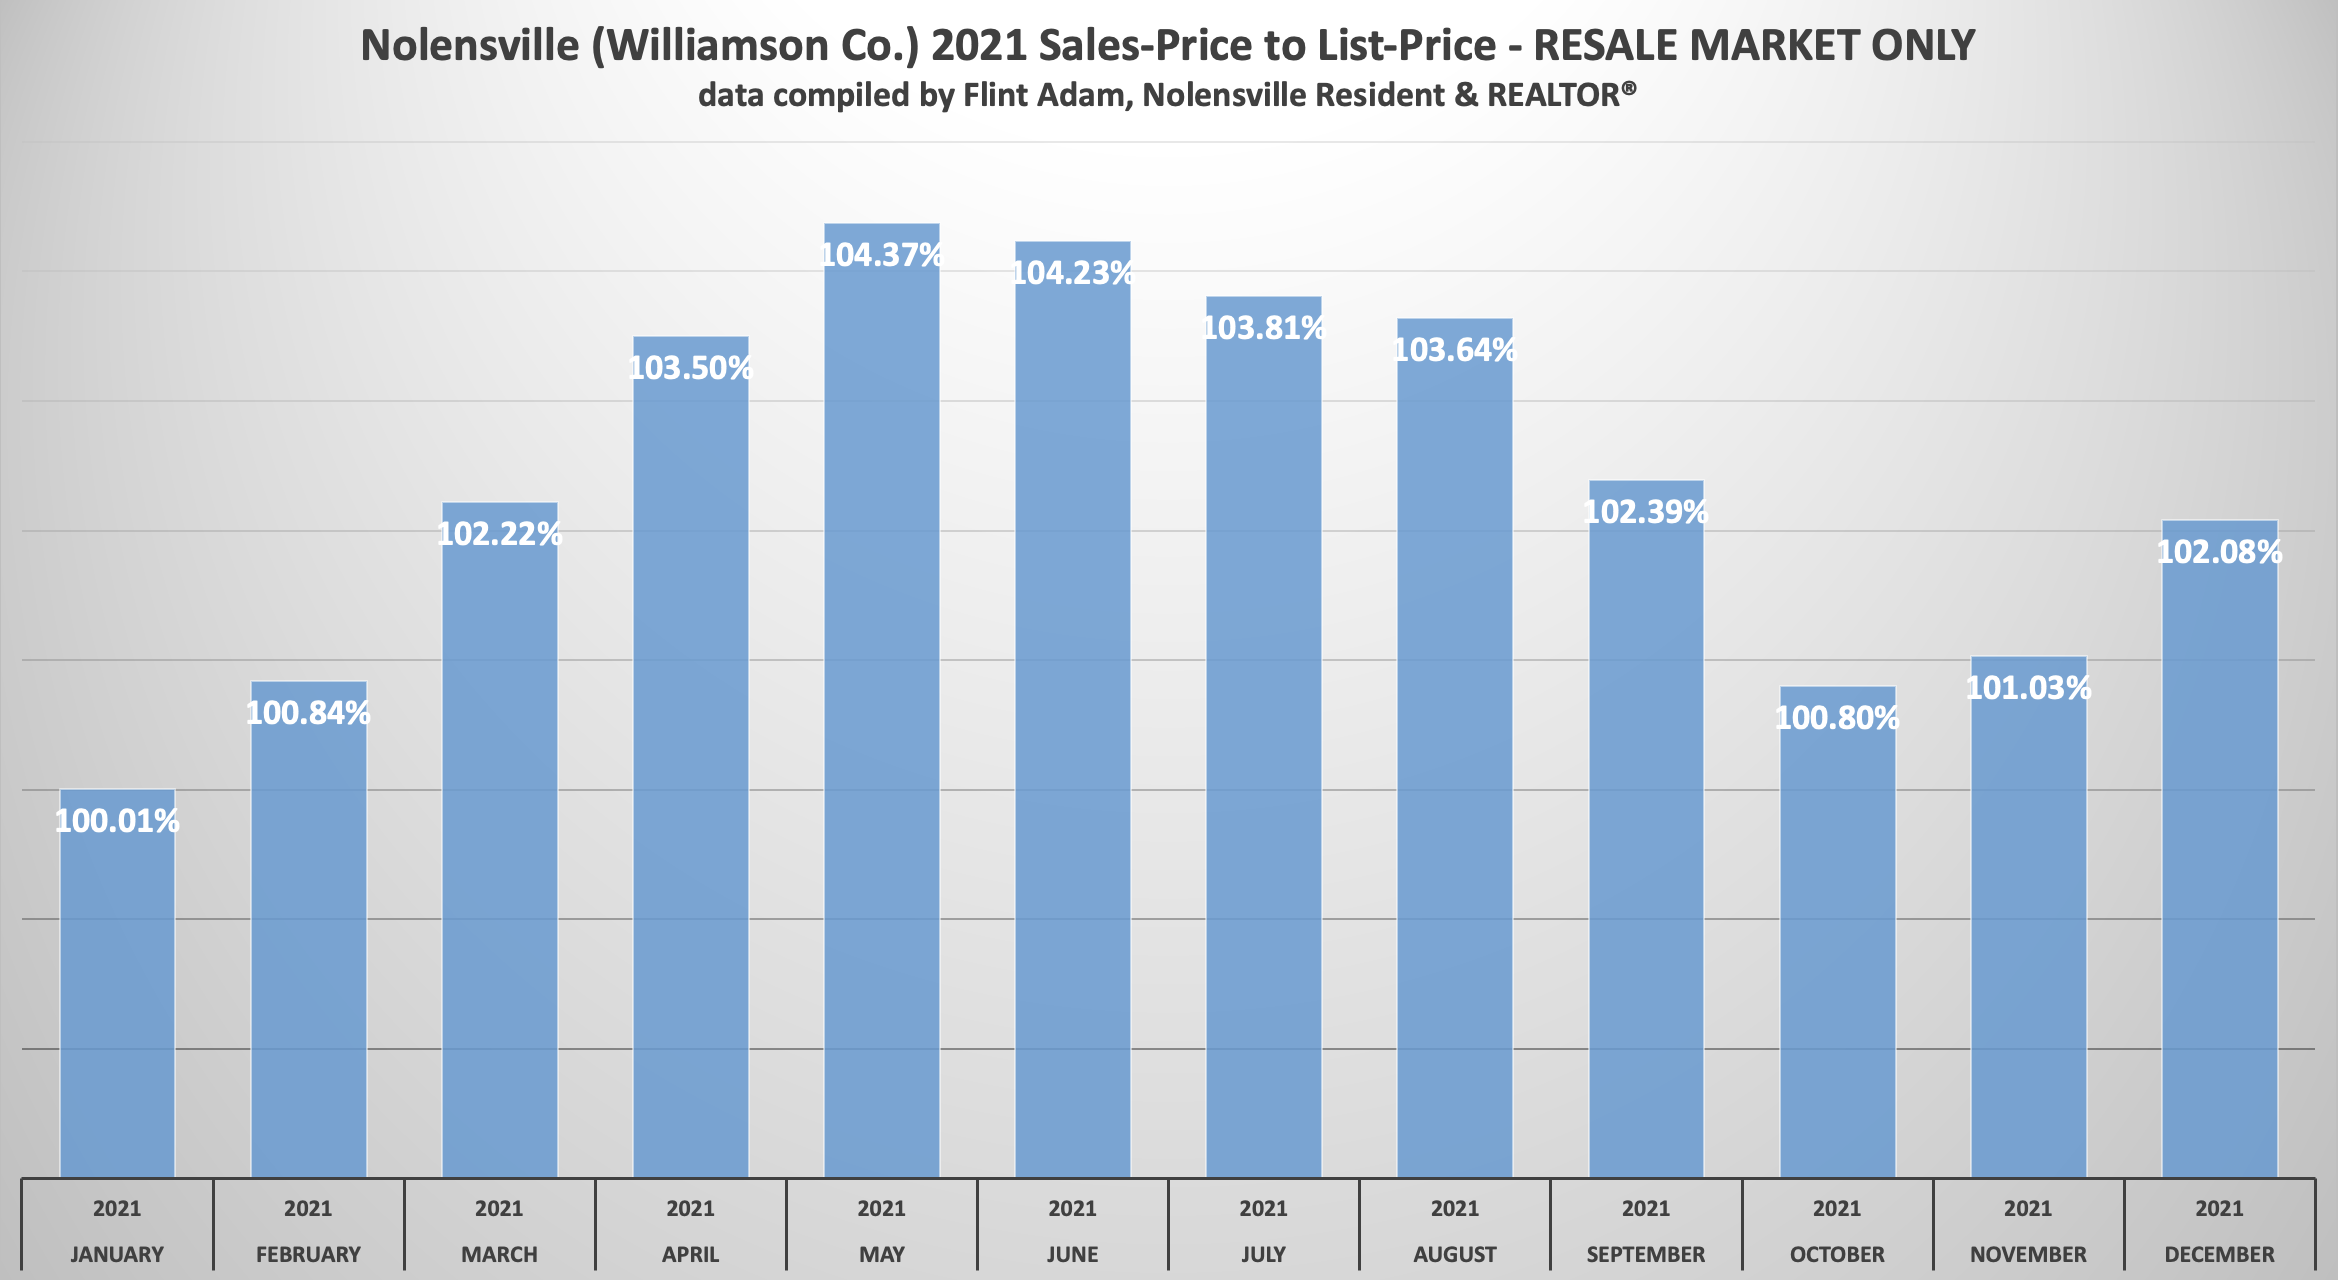
Numbers relaxed bit by bit as we continued through the year and inventory improved. In fact, October sales were just barely above asking-price – the second lowest sales price/list price of the year at 100.80%.
But then offers started getting aggressive again in November as inventory once more dwindled… and then December brought a sizable jump.
That leads us into 2022.
^^^^^CHECK OUT MY VIDEO BLOG & PLEASE LIKE MY YOUTUBE CHANNEL^^^^^^^
January 2022 Real Estate In Depth…
Last month, only 25 28 home sales closed in Nolensville (Williamson County) – a 37% 32% drop from the year before… and a 53% 47% drop from January 2020, right before COVID-19 took off.
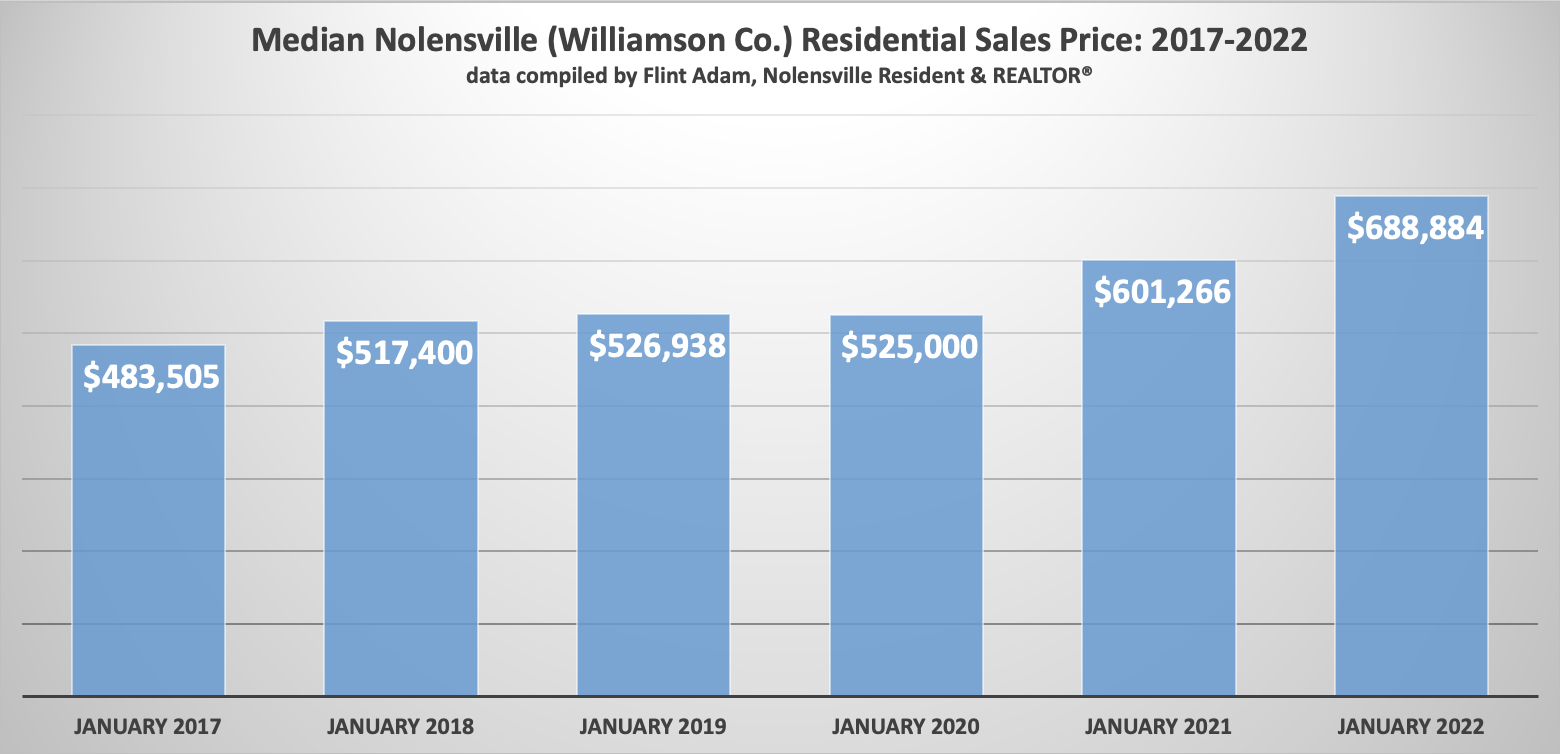
Meanwhile, the median price of a Nolensville home shot up almost $90,000 last month from the year prior, to $690,000 $688,884. That’s almost 15% appreciation in a year. More than 31% appreciation in two years.
Low inventory + low interest rates + high demand = $$$$$$$$$$$$$$$$.
 The average home price in Nolensville last month was even higher at
 $784,907 $778,941. And here is where I circle back to that graphic, above, illustrating the average sales-price-to-list-price ratios.
In all of 2021, the highest SP/LP ratio we saw in the existing homes (resale) market was during May, when it hit 104.37%. Well, last month we beat that. The sales-price-to-list-price ratio for existing Nolensville homes sold in January 2022 was an incredible 105.22% 104.64%.
If we use last month’s average sales price of $784,907 $778,941… it means a buyer had to pay, on average, about $39,000 $35,000 above asking-price in order to secure the winning bid for an existing home purchase in Nolensville.
Two existing home sales last month even closed $100,000 or more above asking. Whew!
All of this to say, it is perhaps more competitive right now in Nolensville real estate than it has been at any point since the pandemic began. If you’re a potential buyer and need a home right now, you need to have your game face on and be ready to swing elbows. It’s dog eat dog and I don’t know at what point the market will again relax.
January 2022 vs. January 2021 Nolensville Home Sales:
2528 Nolensville (Williamson Co.) homes sold… down from 41 (-39.02%-31.71%)- The median sales price was
$690,000$688,884… up from $601,266 (+14.76%+14.57%) - The average days on market was
46… down from 22 (-18 days-16 days) - The sales-price to list-price ratio was
103.29%102.95%… up from 101.14% (+2.13%+1.81%) 910 of the2528 homes (36%) sold were new construction- The lowest price sale was 820 Stonebrook Blvd. in Stonebrook for $480,000.
- The highest price sale was 2632 Benington Place in Benington for $1,375,000.
And here are some of the crazy facts:
- When we eliminate new construction and larger acreage properties and look solely at subdivision resales (
1618 total), some extraordinary figures come to light:- The average sales-price to list-price ratio grows to
105.22%104.64% - 12 of the
1618 sales (75%67%) are above asking-price… anywhere from $5,100 to $138,100 - The average overage of the above-asking price sales is $52,026
- All-cash purchases make up
25%28% of sales - The average days on becomes
24 - 1 of the
1618 resales had a contract fall through before selling - Only 1 of the
1618 resales had to price-reduce before going under contract
- The average sales-price to list-price ratio grows to
*Note: The information above cites Williamson County sales data for Nolensville, Tennessee. There is, of course, a small percentage of Nolensville homes that exist in Davidson and Rutherford counties, but for continuity in my blogging I reference only Williamson County statistics.
Williamson County Sales Stats…
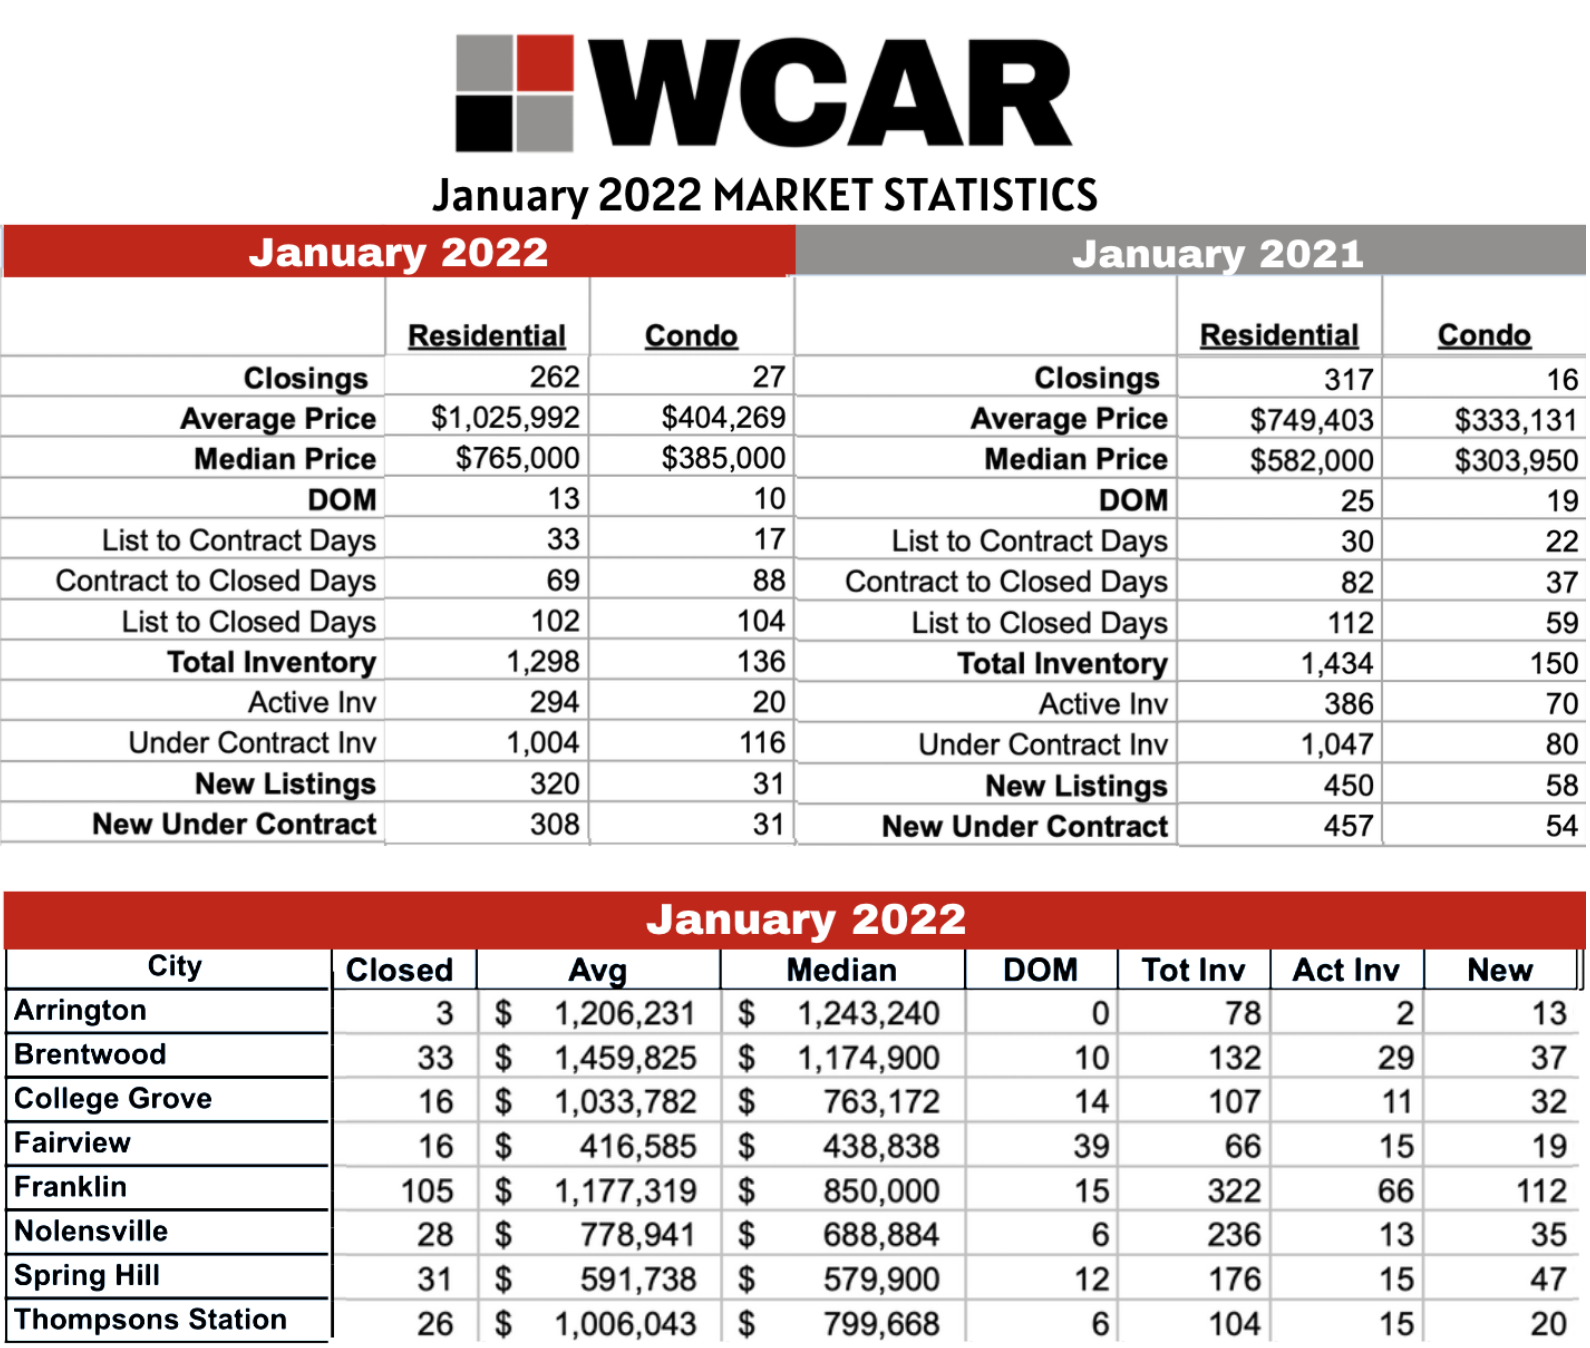
Looking at the year-over-year changes to our marketplace is pretty stupefying. January 2021 had low inventory, sure, but the frenzy hadn’t quite gotten underway yet. The median price in Williamson County last January was was $582,000
Fast forward a year, and now your median Williamson County home price is $765,000… almost 32% higher.
Active/available inventory dropped almost 24%. Almost 3.5x more homes were under contract than available for sale.
Greater Nashville Sales Stats (includes Williamson Co.)…
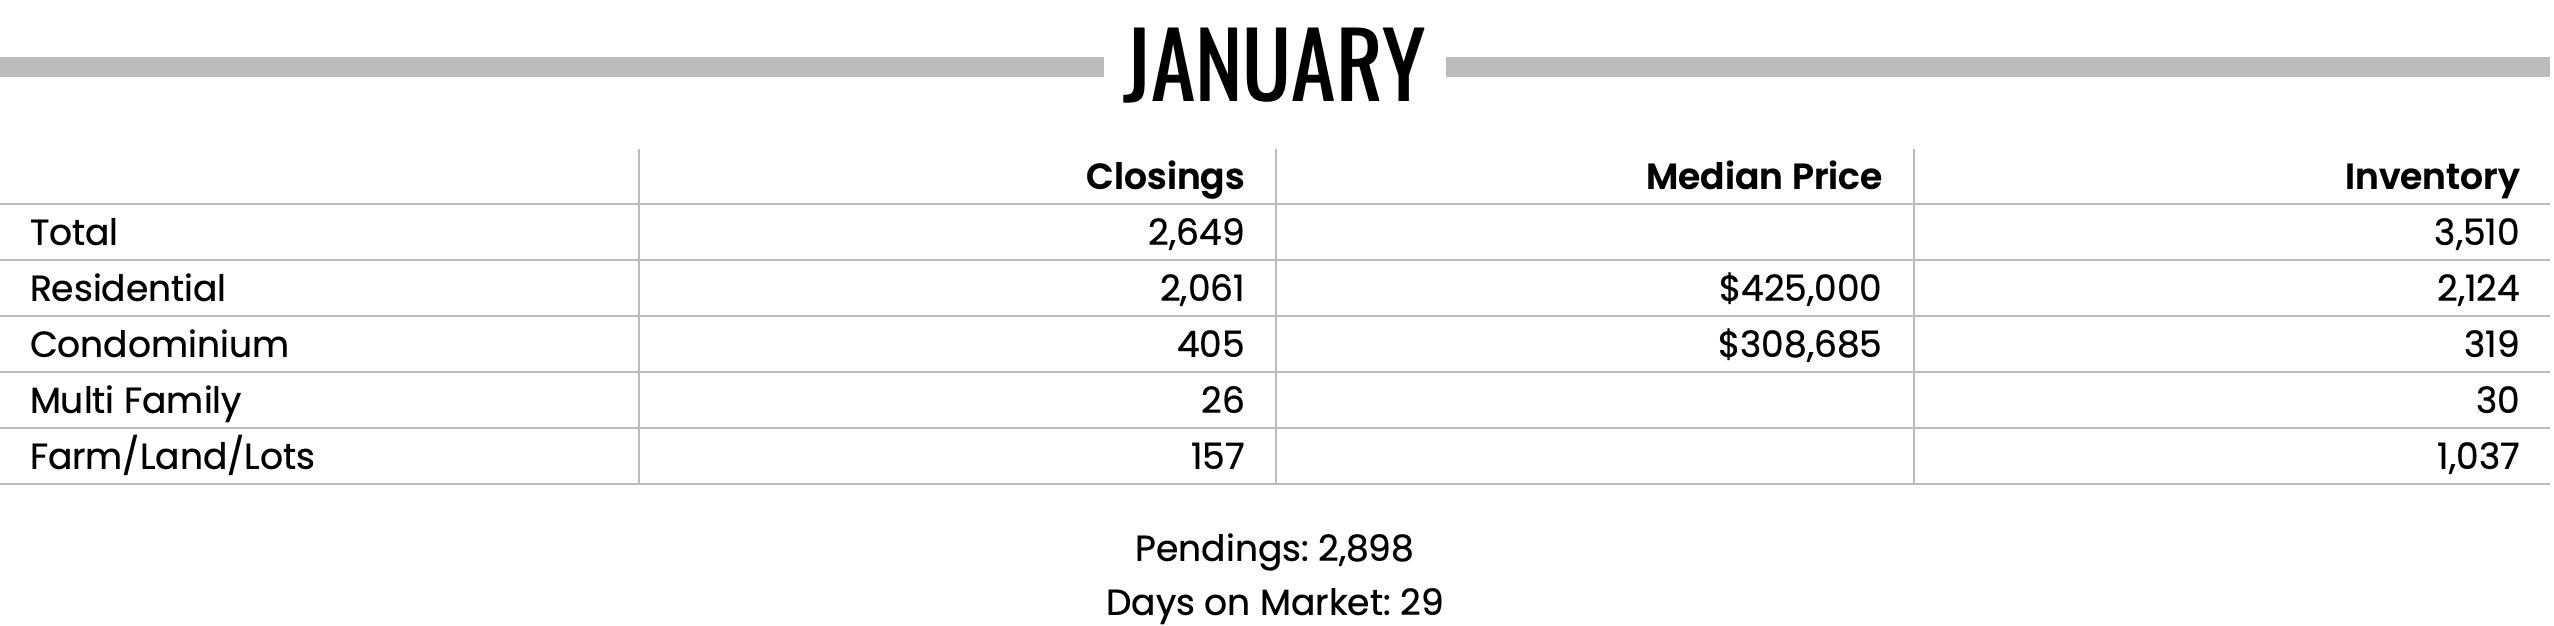
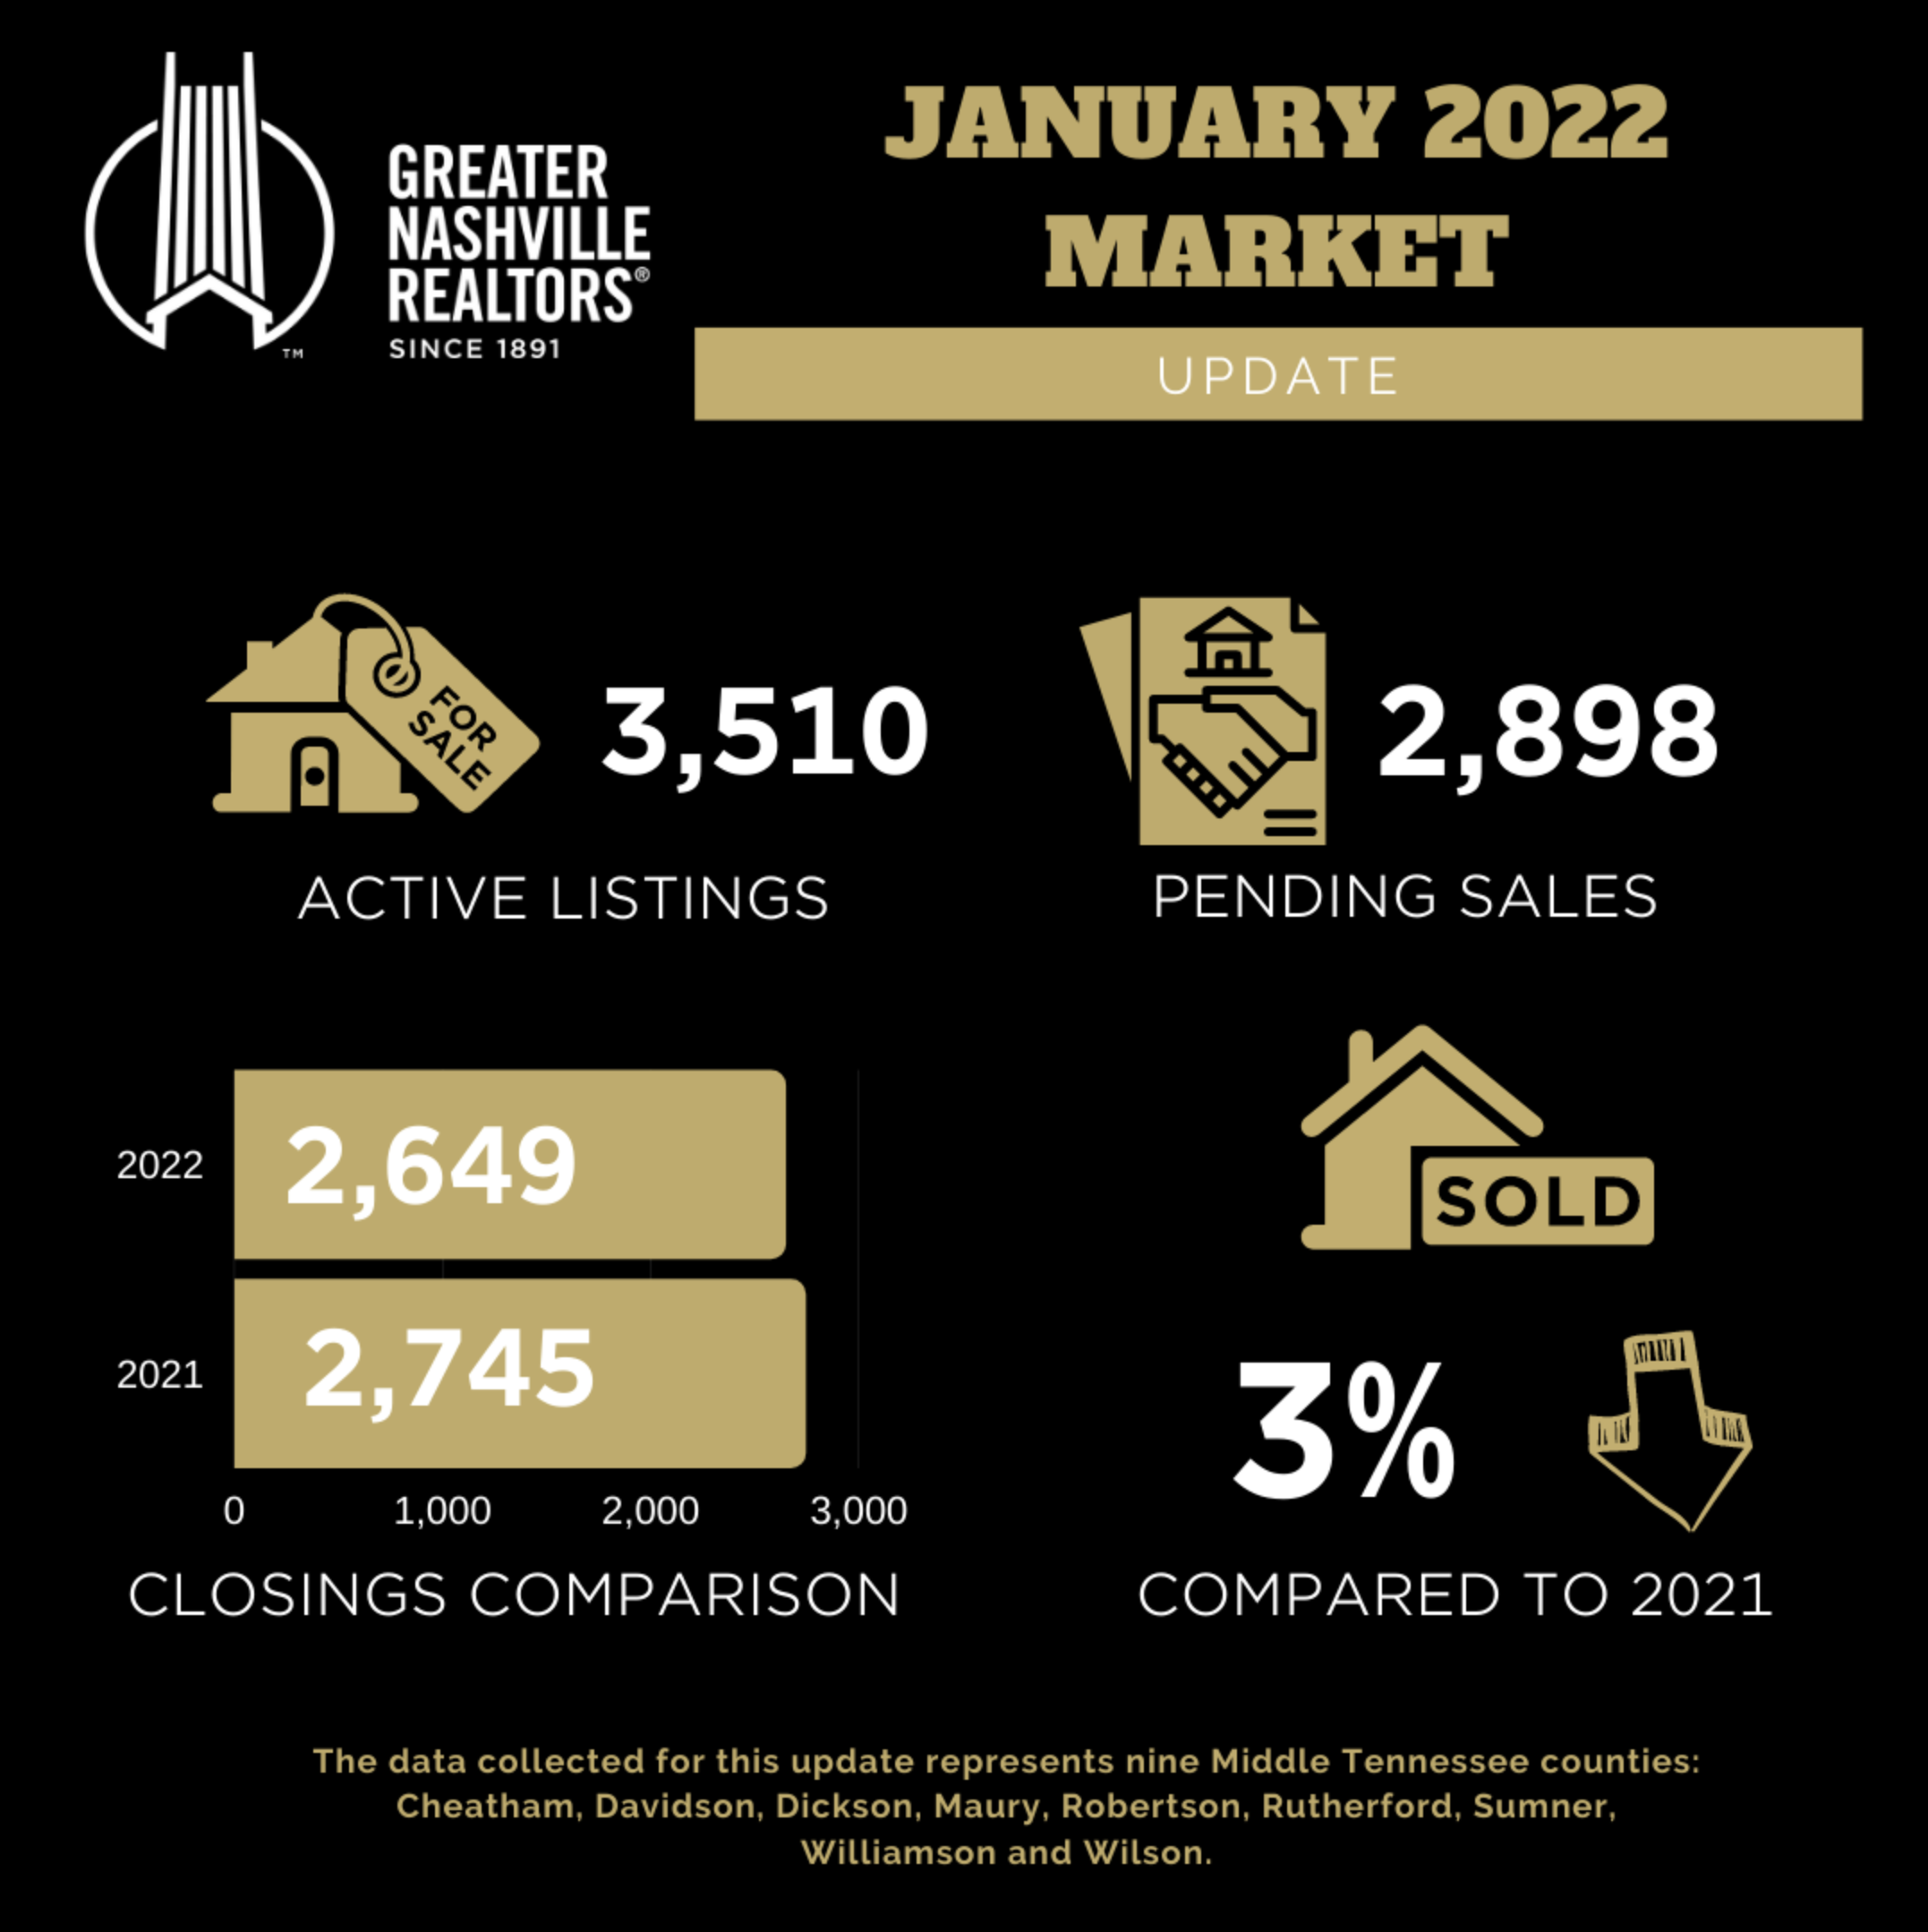
Throughout the Greater Nashville area, the median home price went from $344,920 last year to $425,000 last month… good for a more than 23% jump.
Active/available inventory dropped almost 35%.
Where Does It Go From Here?…
In order for the market to balance, we’re going to need more inventory, fewer bidding wars, and see days on market move back up. Here’s a look at how the existing homes (resale) market in Nolensville (Williamson County) has fared with days on market and SP/LP % over the past decade:
2022 (year-to-date): 2 4 days on market | 105.22% 104.64% Sale Price to List Price Ratio
2021: 7 days on market | 102.66% Sales Price to List Price Ratio
2020: 19 days on market | 99.07% Sales Price to List Price Ratio
2019: 30 days on market | 98.4% Sales Price to List Price Ratio
2018: 30 days on market | 98.57% Sales Price to List Price Ratio
2017: 26 days on market | 98.63% Sales Price to List Price Ratio
2016: 33 days on market | 98.70% Sales Price to List Price Ratio
2015: 32 days on market | 98.40% Sales Price to List Price Ratio
2014: 36 days on market | 97.35% Sales Price to List Price Ratio
2013: 42 days on market | 97.64% Sales Price to List Price Ratio
2012: 57 days on market | 97.66% Sales Price to List Price Ratio
I would love to say that it will get easier soon, but I’m not so sure that’s the case. Great strategy, patience, and cash reserves are needed to compete in today’s real estate market.
The irony is there are countless would-be sellers ready to list their homes for sale, but until they see stability in the marketplace, they’re holding tight. It becomes a self-fulfilling prophecy.
REALTORS are bending every ear, whispering in back channels, and sniffing out any opportunity at an off-market deal. That… and we’re waiting.
Certainly, more homes will come to market as we head into spring and people begin relocating during the warm weather months. But will there be enough homes to satisfy demand?… I’m not holding my breath.
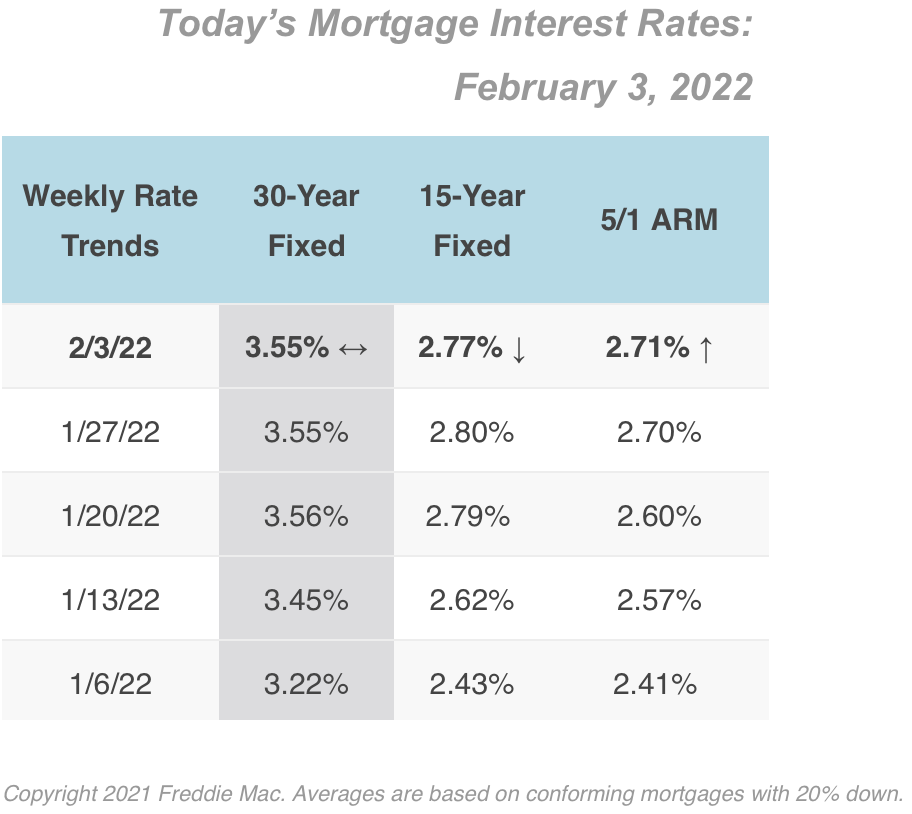
And there’s one more caveat: interest rates.
They’re on the rise, folks, and at some point they’re going to reach a level where it becomes unaffordable for people to move.

If you’re interested in buying… it’s best we plan now.
Interest rates are not likely coming down. There are signals that the Fed will hike rates anywhere from four to seven times in 2022. That will make it more expensive to borrow, and could have other far reaching effects throughout the real estate and stock markets.
Give me a call at 615-500-6393 or email me at flint@theguidehome.com and let’s chat about your goals. It may be best for you to stay put, and if so – I’ll give you that honest opinion. But if there’s a window of opportunity, I’m going to help you open it right on up.
Interested in up to date Nolensville TN real estate sales figures? I’ll email you an HOURLY UPDATED look at Nolensville real estate activity including what has gone pending, price-reduced, and withdrawn. Just shoot me an email with your name and preferred email address to flint@theguidehome.com
The Latest on Mortgage Rates…
 2/3/2022 Commentary by Nolensville resident, Jesse Alvarez, with The Mortgage Exchange
Last week the Federal Reserve announced they will be raising interest rates very soon to combat the extreme inflation environment we are dealing with. The “Fed” spoke of the possibility of raising rates by as much as 0.5% at the next Fed meeting in March. They also made it clear that they wouldn’t be opposed to raising rates at every meeting throughout the rest of the year versus the original talk of only raising rates at quarterly meetings. This aggressive rate hike talk has continued to push mortgage rates higher. 30 year mortgage rates are now in the upper 3% range as most borrowers are being quoted 3.75%-3.875%. As we get closer to the next Fed meeting, we should see rates continue their slow and steady climb. As rates continue to rise throughout the year, they will have more and more of an impact on the housing market. This affect is usually felt later on in markets with more Jumbo loans (versus markets that are closer to the national home price average), so don’t expect Williamson County to flinch over higher interest rates anytime soon.
Outside of the housing market, rising interest rates will also have a profound affect on Commercial Loans. Commercial Loans tend to lean heavier towards adjustable rates and are usually tied to the Prime Rate as posted in the Wall Street Journal. The Prime Rate always rises with the Federal Reserves Fed Funds Rate, so when the Fed raises that rate next month, millions of business owners around the country will see an immediate increase in their loan payments, with more increases each month the Fed raises rates throughout the year. These increases can be dramatic for small business owners, and we know those rising costs tend to have a trickle down affect to consumers. So don’t expect these inflationary trends to slow down anytime soon.

Flint Adam is an 11- year Nolensville resident and lives with his wife and children in Bent Creek. He focuses his real estate practice here in town, having served more than 160 buyers and sellers in closed Nolensville real estate transactions. Flint enjoys blogging about local real estate, traveling the world, photography, and hiking. He is passionate about serving Nolensville and keeping it one of America’s greatest small towns.