

by Flint Adam, Nolensville resident & REALTOR®
One day, folks, I’m going to write about a real estate market that is calming down. I’ll write about stabilizing prices and homes that take three or four weeks to sell. We’ll all grin and laugh about those crazy times when people were forking over tens of thousands of dollars above asking-price in order to secure a home purchase.
I’m just not writing about that today.
No, ladies and gentlemen, the crazy continues and we’ll all need straight jackets soon because this is insanity. Despite there being seemingly little to buy, we still had a decent number of sales in February. Thirty home sales closed last month, which is only one less than the number closed during February 2021. Even more impressive is that more existing homes sold last month (18) than during the February before (14).
Ah, but the devil is in the details, and that’s where real estate hell really shows itself.
You see, getting that Nolensville home last month didn’t come easy. Or cheap. Of the eighteen existing homes that closed last month, a buyer paid above asking-price on thirteen of them. Meanwhile, a full third of February’s existing home sales were all-cash transactions. Impressive (or daunting) in its own right, it becomes even crazier when I tell you that three of those six cash transactions last month sold anywhere from $1.6M to $2M.
That is not a typo.
So strap in, folks, and prepare to be impressed by these amazing figures.
February 2022 Real Estate In Depth…
Last month, 30 home sales closed in Nolensville (Williamson County), one less than February of last year.
Median home prices were night and day different, though. In February 2021, the median home price in Nolensville was $589,900. Last month, it hit an all-time high of $880,153 – a 49.2% year-over-year rise! The median price is up 60.03% compared to February 2020, when it was $549,994.
And while those figures above look at the single-family home market as a whole (new construction + existing homes sales), the numbers become especially eye-watering when we scrub the data to consider only the existing homes segment of the market.
Considering only that segment, the median selling price becomes $907,500 – DOUBLE what it was two years ago!
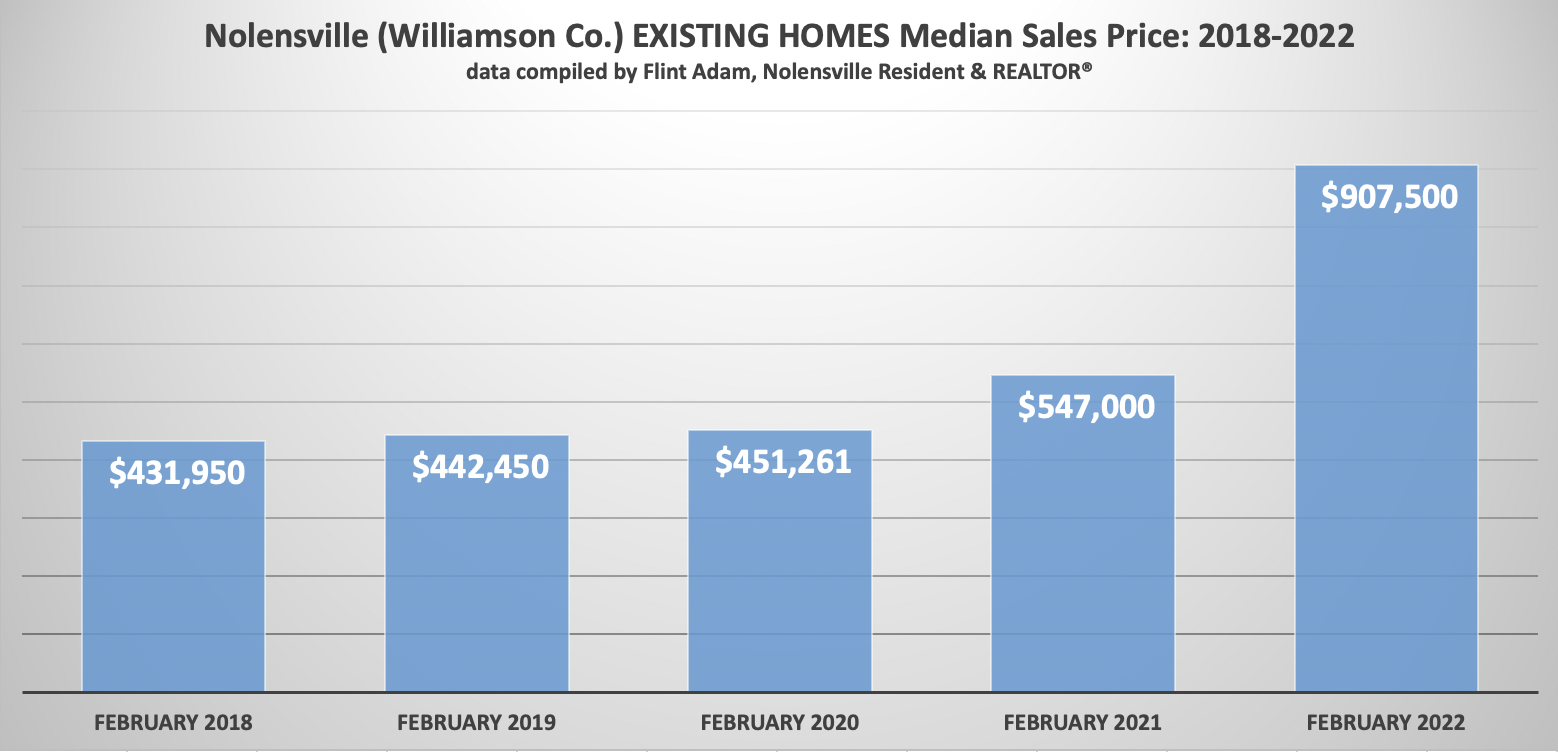
The existing homes segment is a better indicator of market temperature because it’s happening in real time. These homes are up for competition and generally close within thirty to forty days. New construction can often take seven to 12 months to complete, and the prices are typically locked in well in advance of closing. New construction also isn’t usually up for bidding wars – builders most often sell first come, first serve.
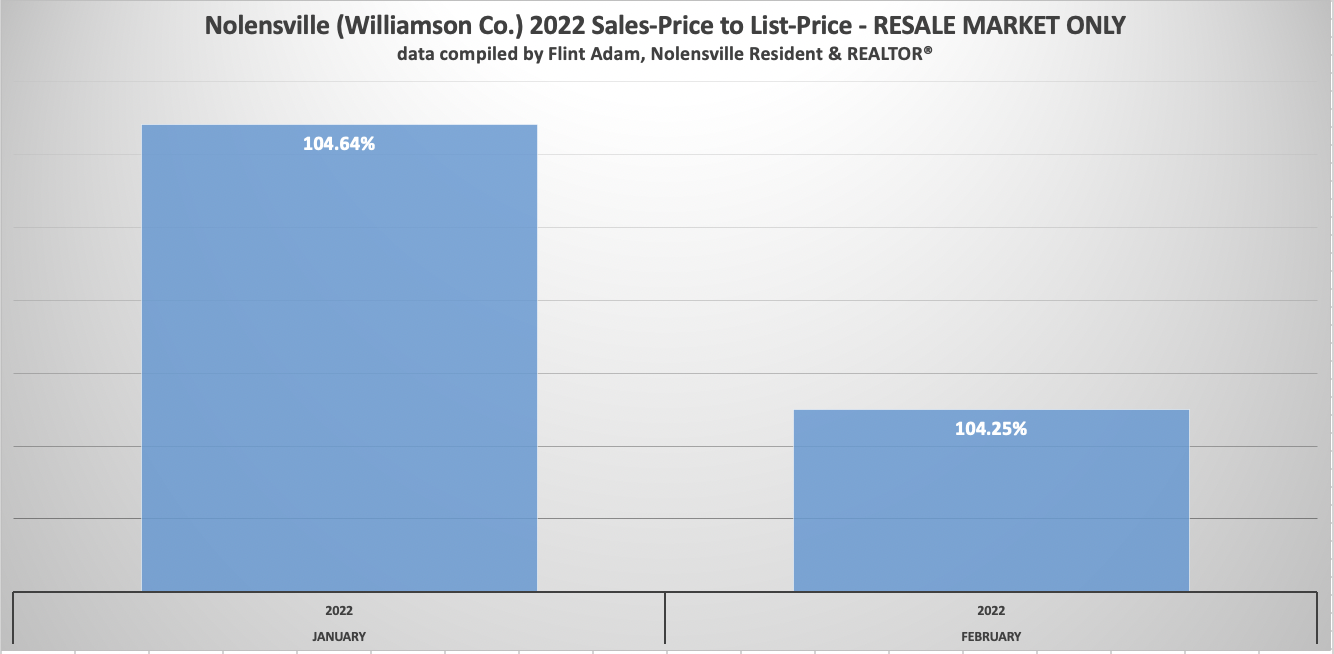
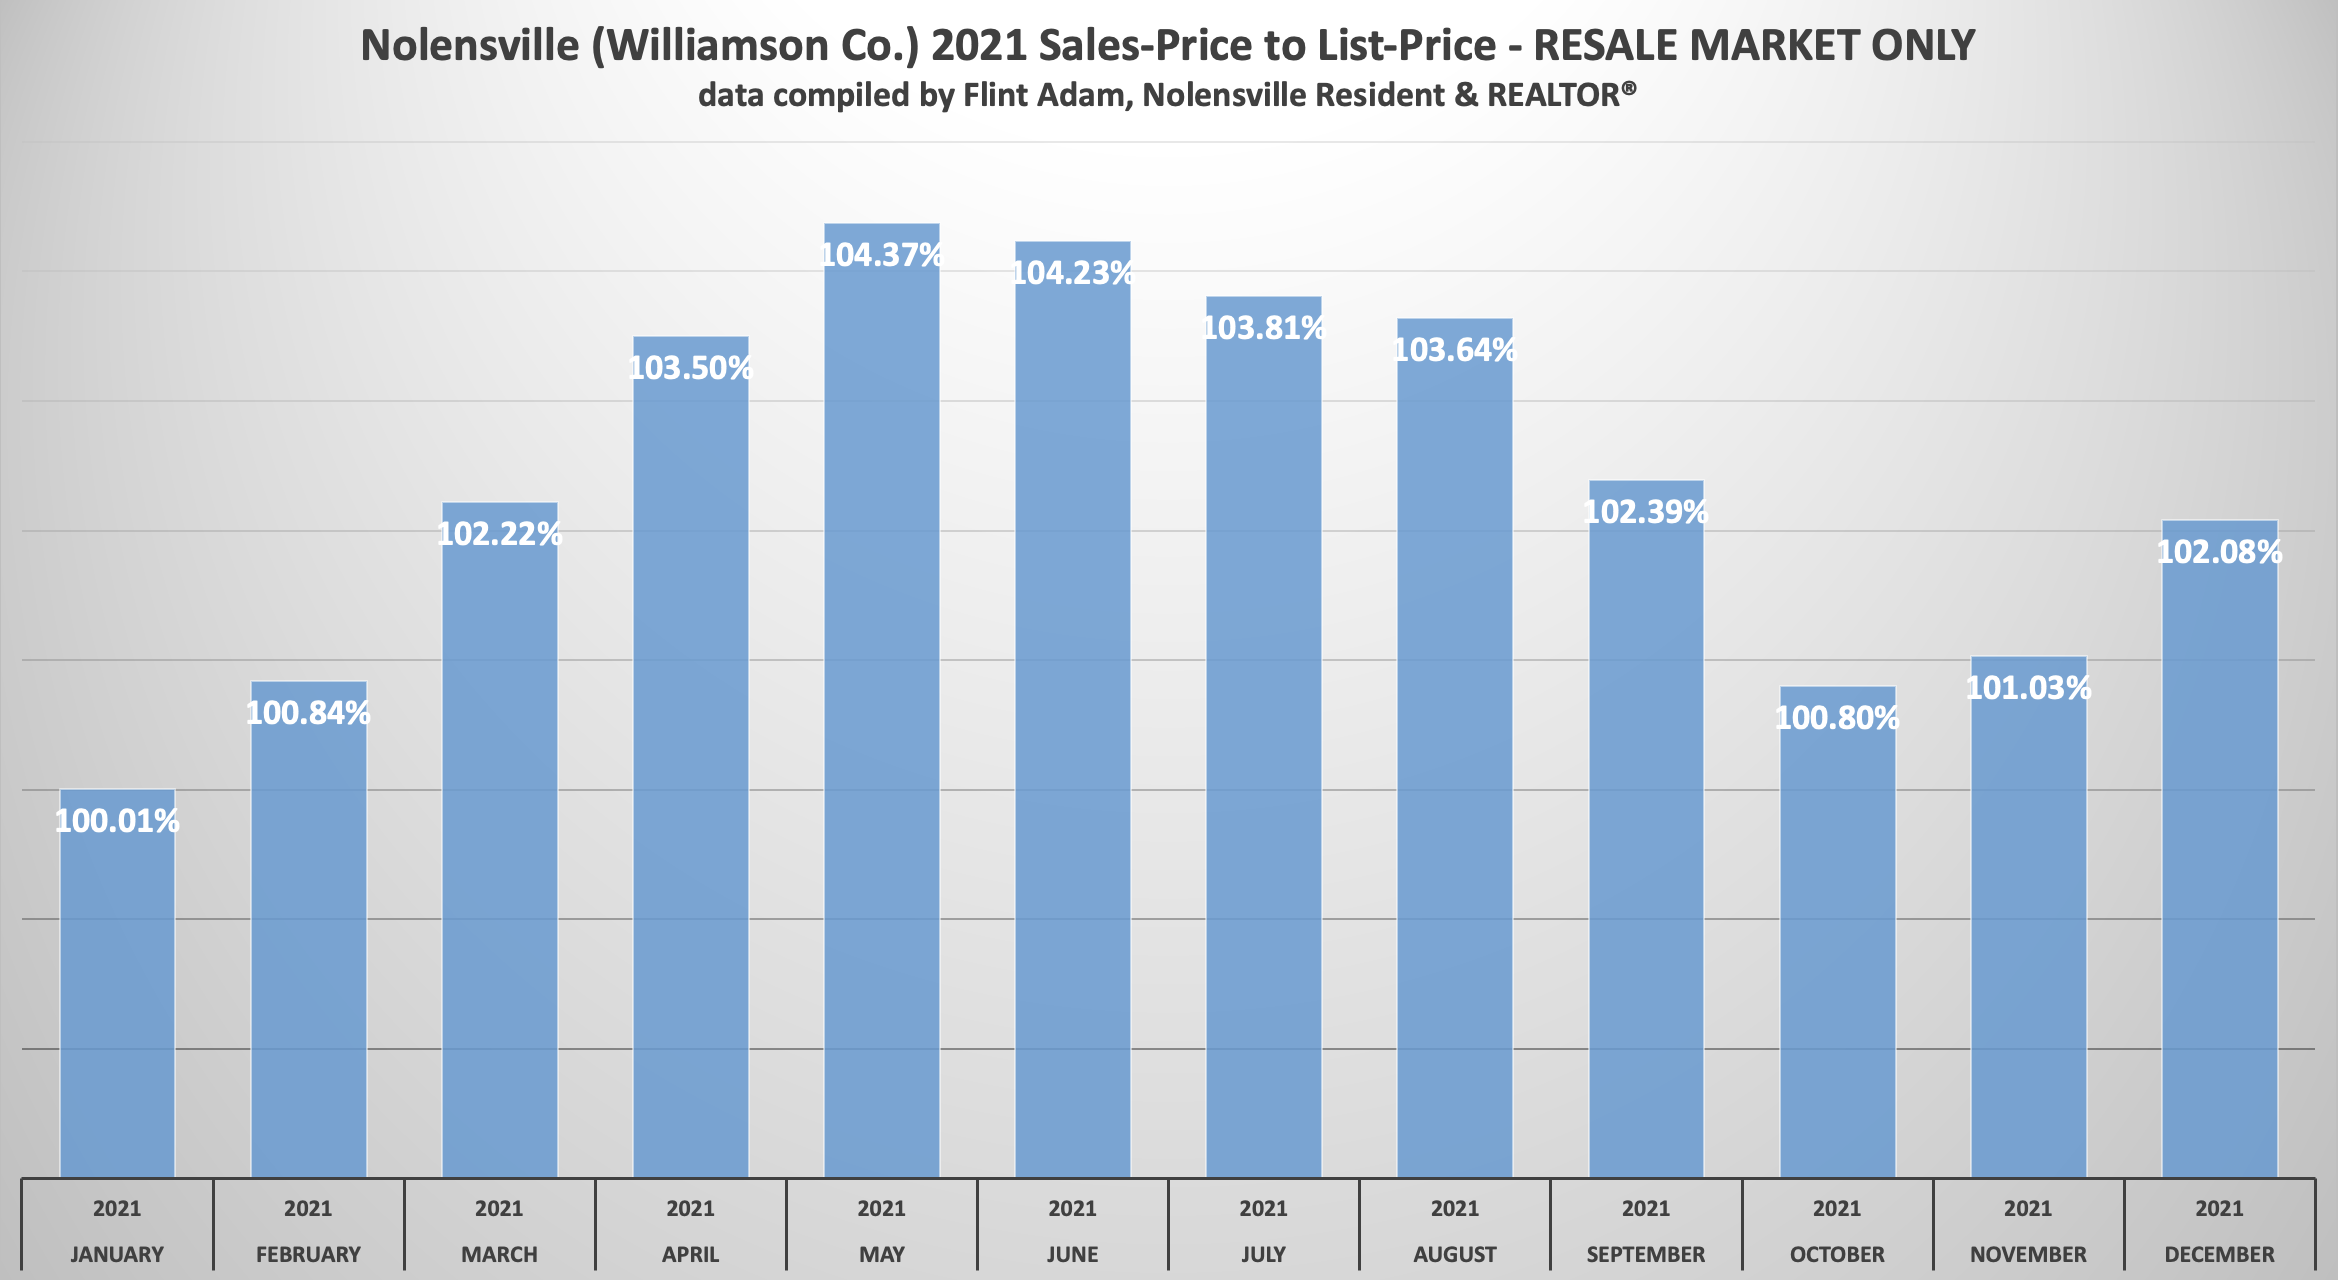
Buyer aggression is much stronger at the start of 2022 than it was a year ago. In both January and February, buyers paid greater than 4% above asking-price on homes they purchased.
Compare that with all of last year when buyers paid more than 4% above asking-price only during peak real estate months of May and June.
If there is one positive that buyers can latch onto, it’s that the SP/LP went down from January to February, if only slightly. Will that trend hold? We’re halfway through March and the numbers so far show a very clear path. You’ll have to come back next month, though, for the reveal.
February 2022 vs. February 2021 Nolensville Home Sales:
- 30 Nolensville (Williamson Co.) homes sold… down from 31 (-3.23%)
- The median sales price was $880,153… up from $589,900 (49.2%)
- The average days on market was 12… down from 20 (-8 days)
- The sales-price to list-price ratio was 103.22%… up from 100.58% (+2.62%)
- 12 of the 30 homes (40%) sold were new construction
- The lowest price sale was 107 Mill Creek Ln. in Stonebrook for $285,000.
- The highest price sale was a tie – 100 Hadley Reserve Ct in Hadley Reserve and 9835 Clovercroft Rd each sold for $2,000,000.
And here are some of the crazy facts:
- When we eliminate new construction and larger acreage properties and look solely at subdivision resales (16 total), some extraordinary figures come to light:
- The median sales price becomes $927,106
- The average sales-price to list-price ratio grows to 106.03%
- 13 of the 16 sales (81%) are above asking-price… anywhere from $5,000 to $225,000 (more on that, below)
- The average overage of the above-asking price sales is $68,615
- All-cash purchases make up 37.5% of sales
- The average days on becomes 2
- None of the subdivision resales had a contract fall through before selling
- None of the subdivision resales had to price-reduce before going under contract
- Captain of the crazy train last month was the sale of 1508 Pumpkin Ridge Court in Benington. I actually listed and sold this property back in 2017 for $607,100… just a little over asking-price back in the day.Fast forward to this year and the property listed for $1,050,000 and hit the perfect storm of low inventory and a very in-demand neighborhood… catching a contract that was $225,000 above asking-price and closing at $1,275,000. Unreal.
*Note: The information above cites Williamson County sales data for Nolensville, Tennessee. There is, of course, a small percentage of Nolensville homes that exist in Davidson and Rutherford counties, but for continuity in my blogging I reference only Williamson County statistics.
Williamson County Sales Stats…
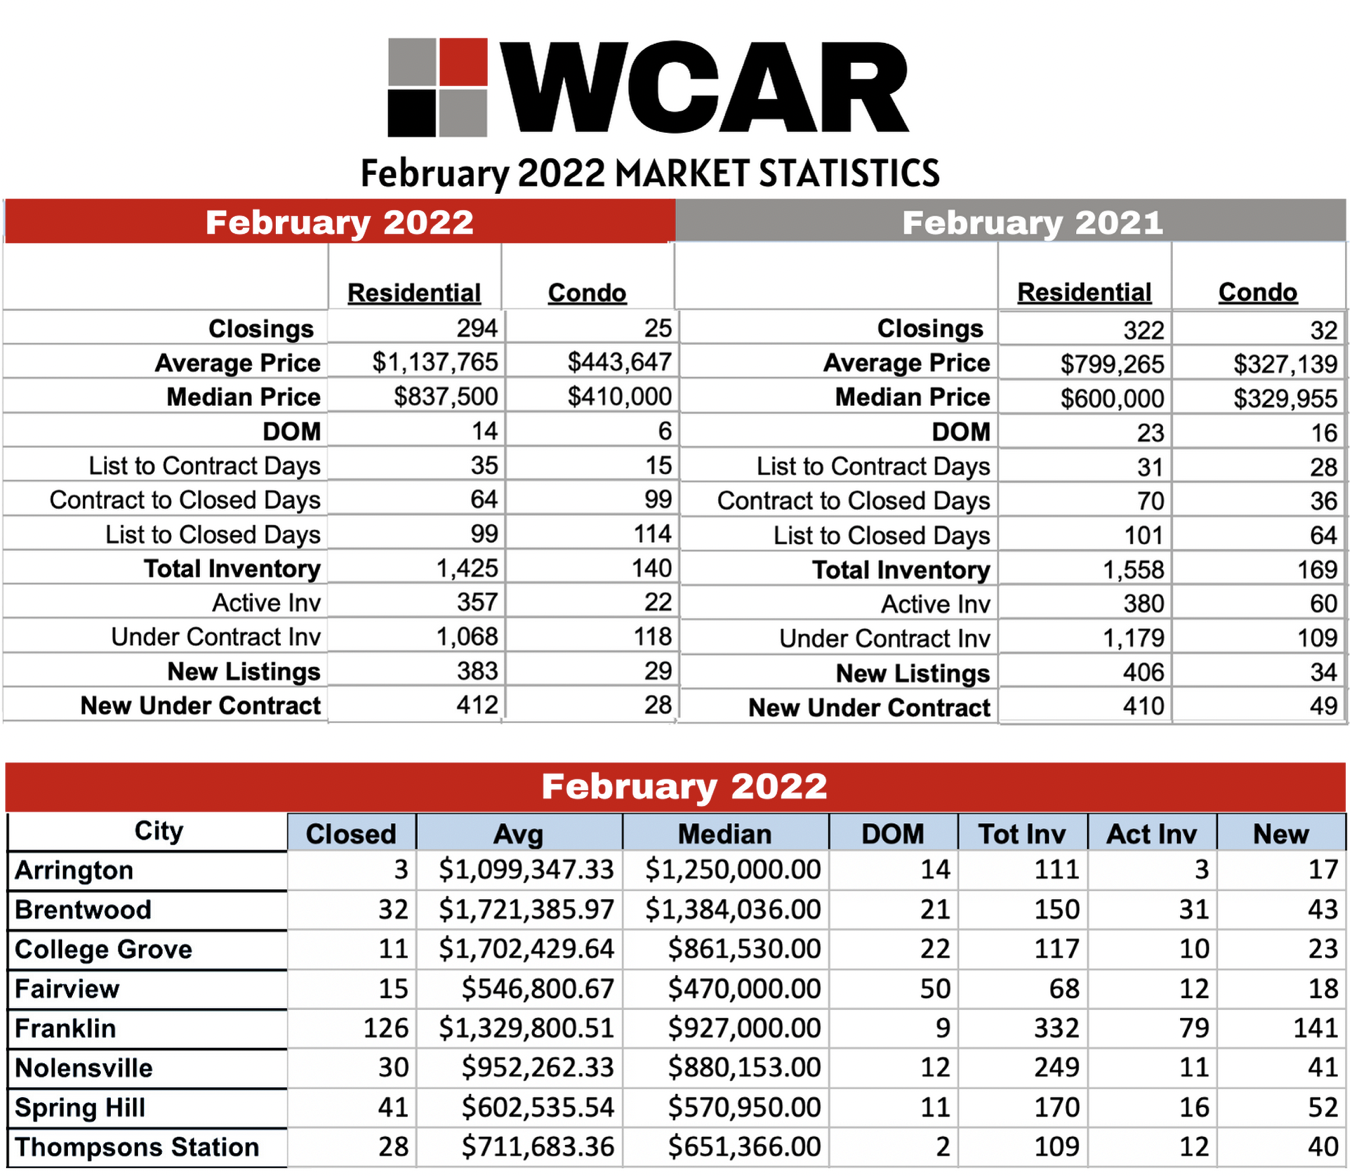
Continuing a trend that has been going on for some time, active inventory is down year-over-year… this time by 6.05%.
New listings also remain down by 5.67%. Until that number reverses course it will be difficult for the market to stabilize.
It’s really something to see the median price in Brentwood sitting at $1,384,036. Arrington is not far behind it, either.
Greater Nashville Sales Stats (includes Williamson Co.)…
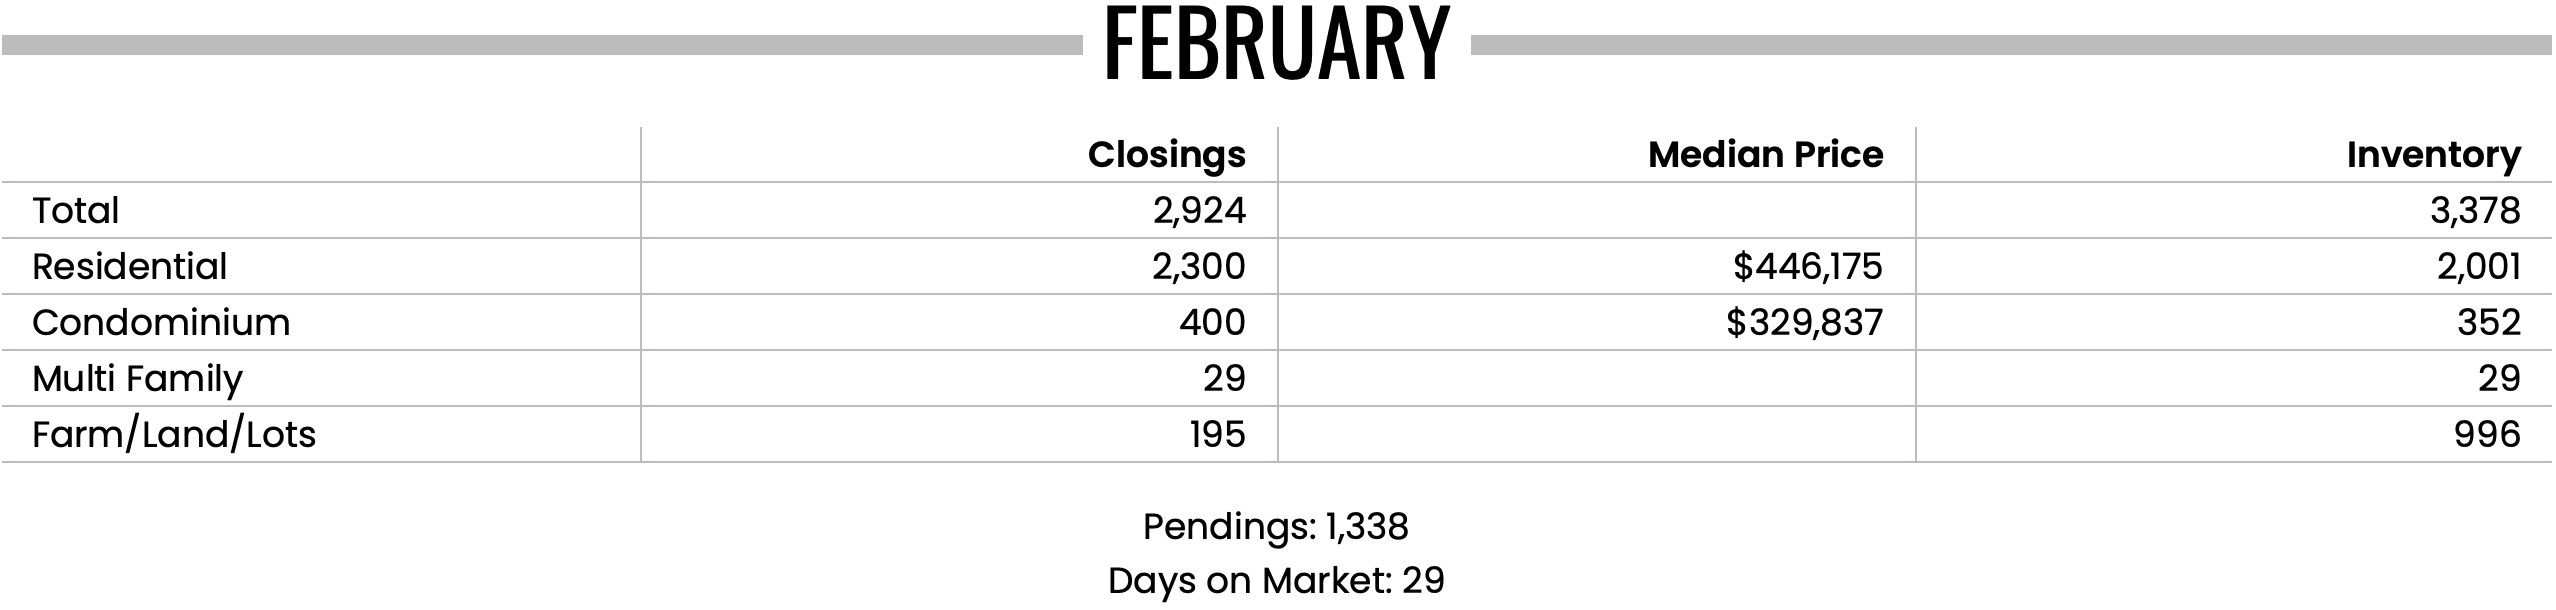
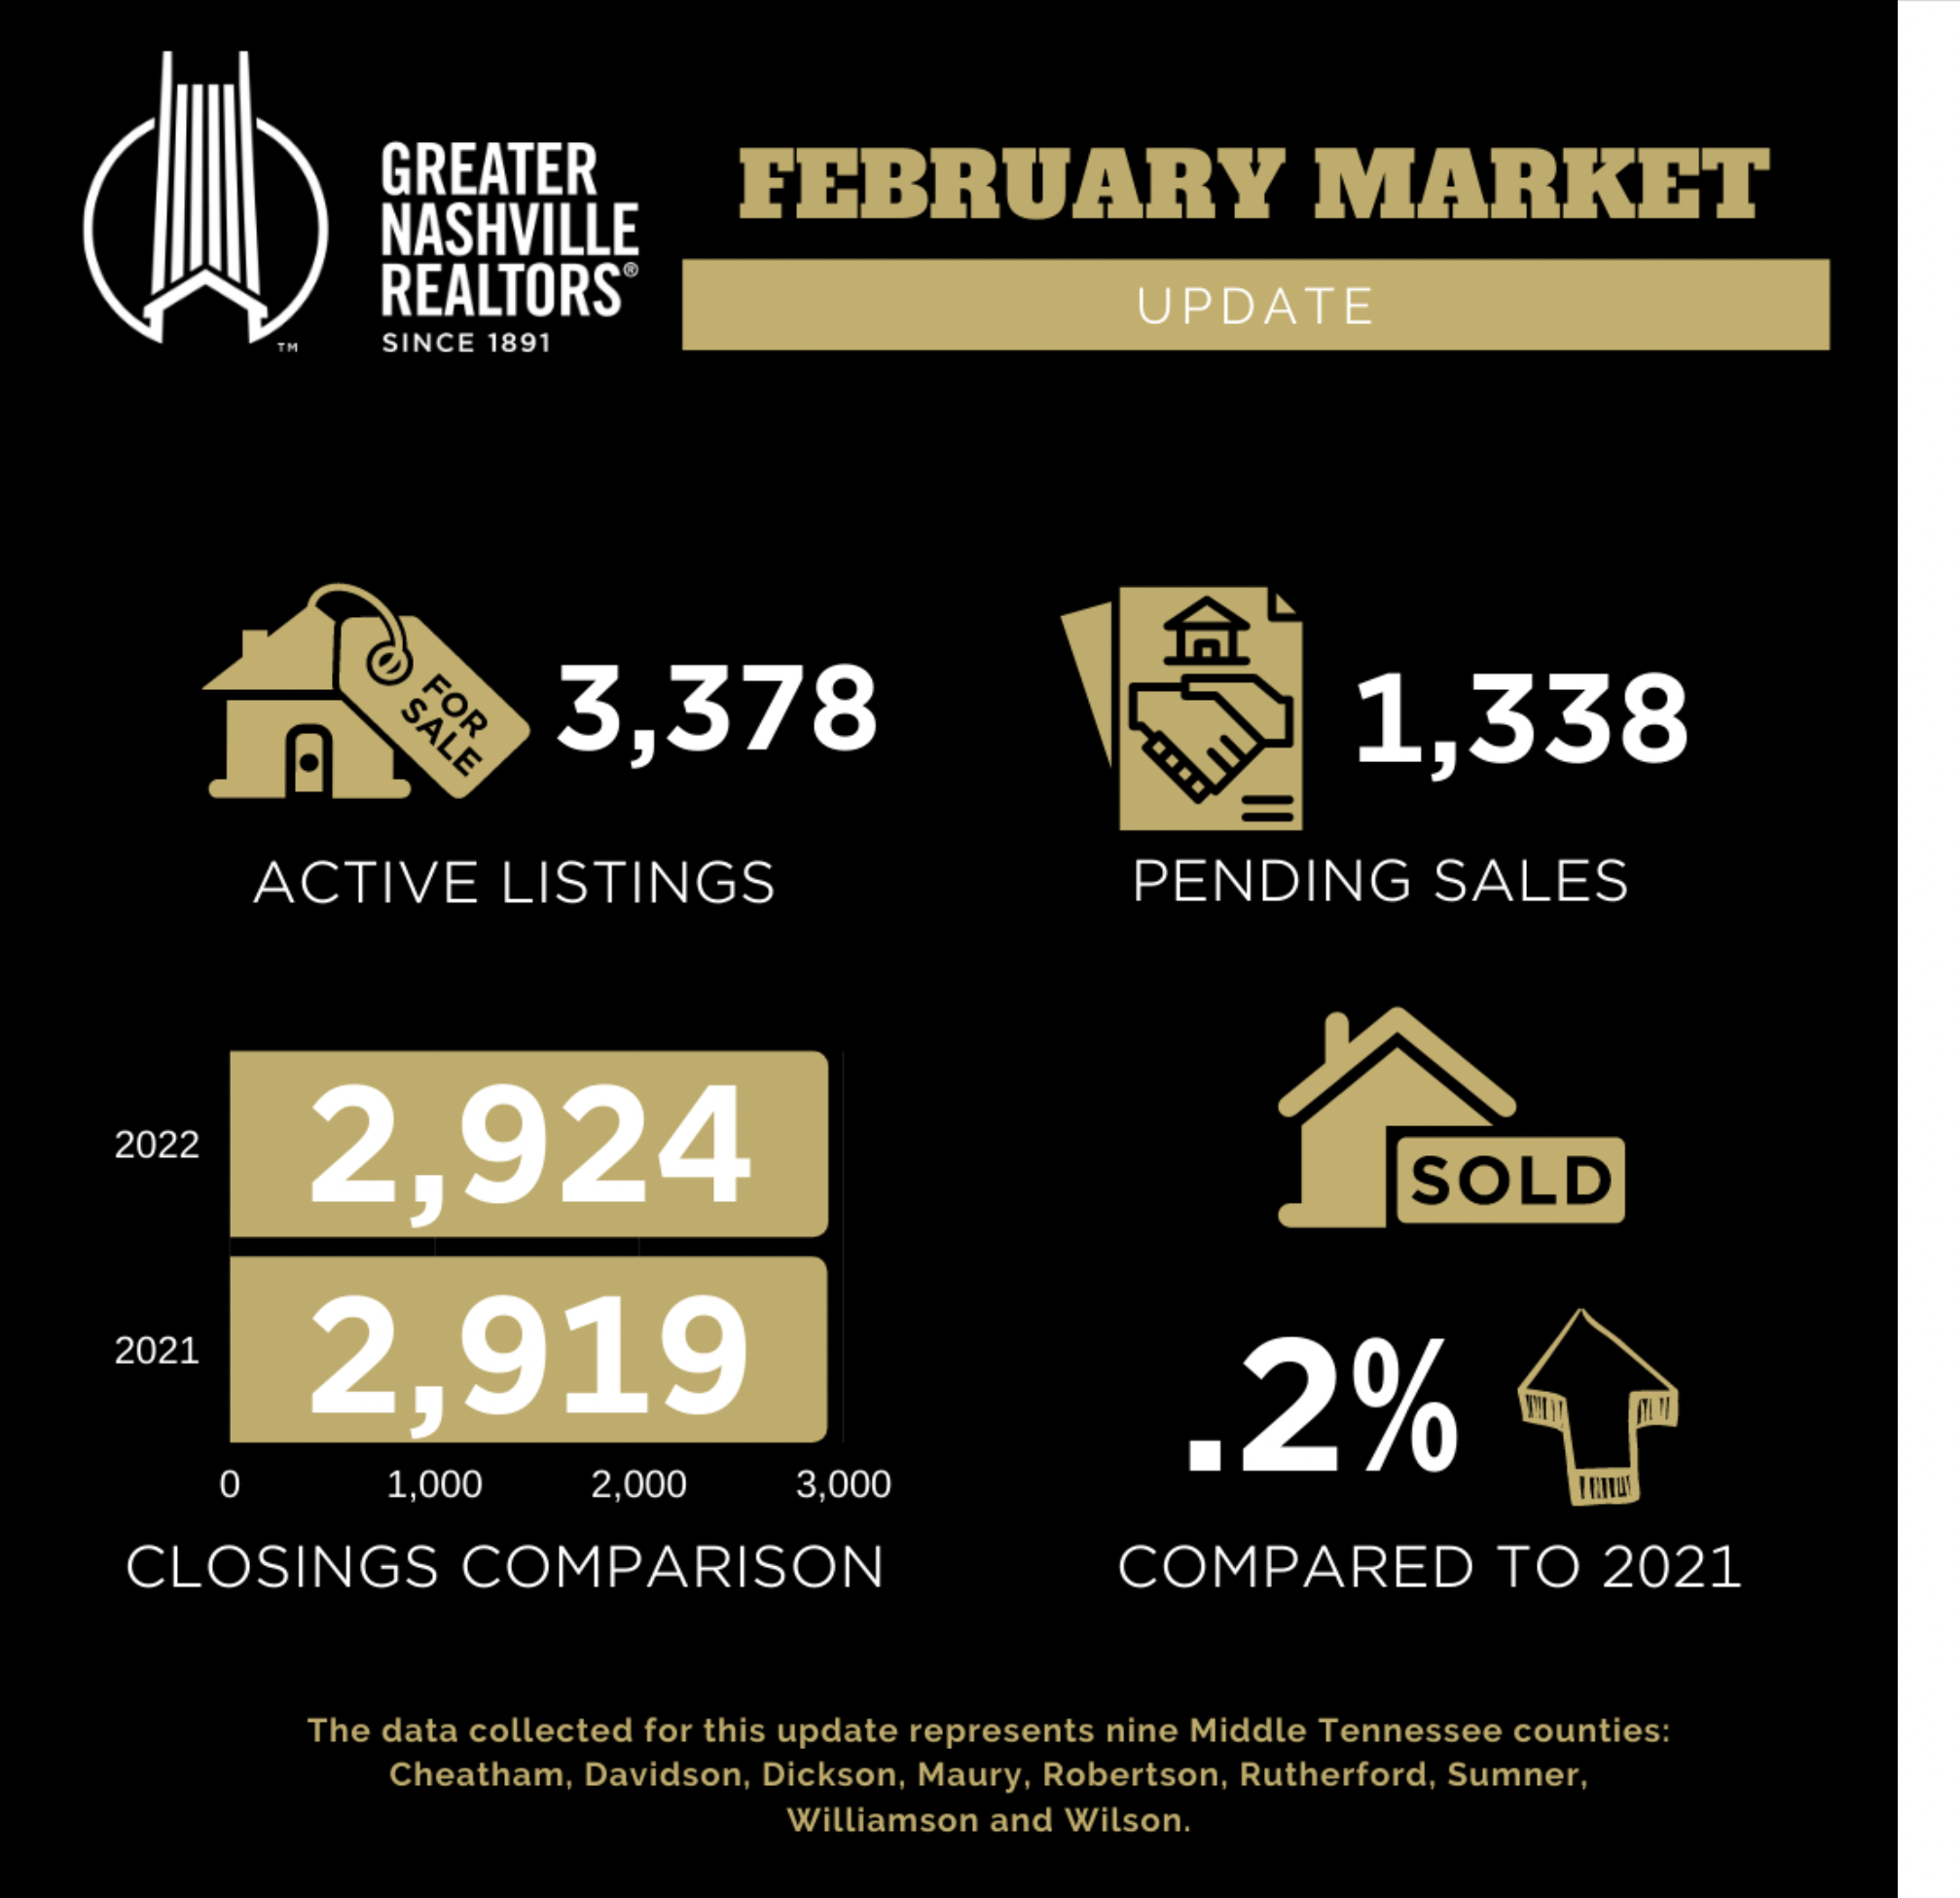
Throughout the Greater Nashville area, the median home price went from $357,150 last year to $446,175 last month… good for a more than 24.93% jump.
Active/available inventory dropped almost 20.18%.
Where Does It Go From Here?…
In order for the market to balance, we’re going to need more inventory, fewer bidding wars, and see days on market move back up. Here’s a look at how the existing homes (resale) market in Nolensville (Williamson County) has fared with days on market and SP/LP % over the past decade:
2022 (year-to-date): 7 days on market | 105.19% Sale Price to List Price Ratio
2021: 7 days on market | 102.66% Sales Price to List Price Ratio
2020: 19 days on market | 99.07% Sales Price to List Price Ratio
2019: 30 days on market | 98.4% Sales Price to List Price Ratio
2018: 30 days on market | 98.57% Sales Price to List Price Ratio
2017: 26 days on market | 98.63% Sales Price to List Price Ratio
2016: 33 days on market | 98.70% Sales Price to List Price Ratio
2015: 32 days on market | 98.40% Sales Price to List Price Ratio
2014: 36 days on market | 97.35% Sales Price to List Price Ratio
2013: 42 days on market | 97.64% Sales Price to List Price Ratio
2012: 57 days on market | 97.66% Sales Price to List Price Ratio
If you’re interested in buying or selling, it’s time to talk. As spring break wraps up, spring market heats up.
Interest rates are on the rise and I expect a continued surge of buyer aggression while there is still time to take advantage of low(ish) interest rates.
Give me a call at 615-500-6393 or email me at flint@theguidehome.com and let’s chat about your goals. It may be best for you to stay put, and if so – I’ll give you that honest opinion. But if there’s a window of opportunity, I’m going to help you open it right on up.
Interested in up to date Nolensville TN real estate sales figures? I’ll email you an HOURLY UPDATED look at Nolensville real estate activity including what has gone pending, price-reduced, and withdrawn. Just shoot me an email with your name and preferred email address to flint@theguidehome.com
The Latest on Mortgage Rates…
 3/17/2022 Commentary by Nolensville resident, Jesse Alvarez, with The Mortgage Exchange
Well the Fed has finally done it. They have raised interest rates. Yesterday the Fed raised the United States benchmark rate, the Fed Funds Rate, by 0.25% to a range of 0.25% to 0.50%. This took the country’s overnight lending rate from 0.08% all the way up to 0.33%. So what does this mean for us? Not much in regards to todays mortgage rates. This rate hike was already “baked in the cake”. However, if you do have a commercial loan attached to the Prime lending rate, your loan just went up 0.25% (the Wall Street Journal Prime Rate is generally priced at the Fed Funds rate plus 3%).
Contrary to popular opinion, when the FOMC (the Fed) raises the Fed Fund rate, it does not mean that mortgage rates have been raised as well. There is definitely a correlation between the two things, but mortgage rates do not immediately move in lock step with the Feds rate policies. Mortgage rates did NOT go up a quarter point yesterday. But the market conditions that move mortgage rates saw this move coming for a couple of month so they have already adjusted rates accordingly. And mortgage rates should continue to go up, just as those same market forces see that the Fed has declared they will continue raising rates for the foreseeable future. Mortgage rates actually held steady after the news yesterday as they heard nothing coming from the Fed’s Chairman that sounded more aggressive in regards to future rates then what the market was already anticipating. Uncertain global issues have steadied rates a little over the last couple weeks. A deterioration of global security in Europe could cause mortgage rates to pull back heavily if the market thinks circumstances could escalate closer to a World War III scenario.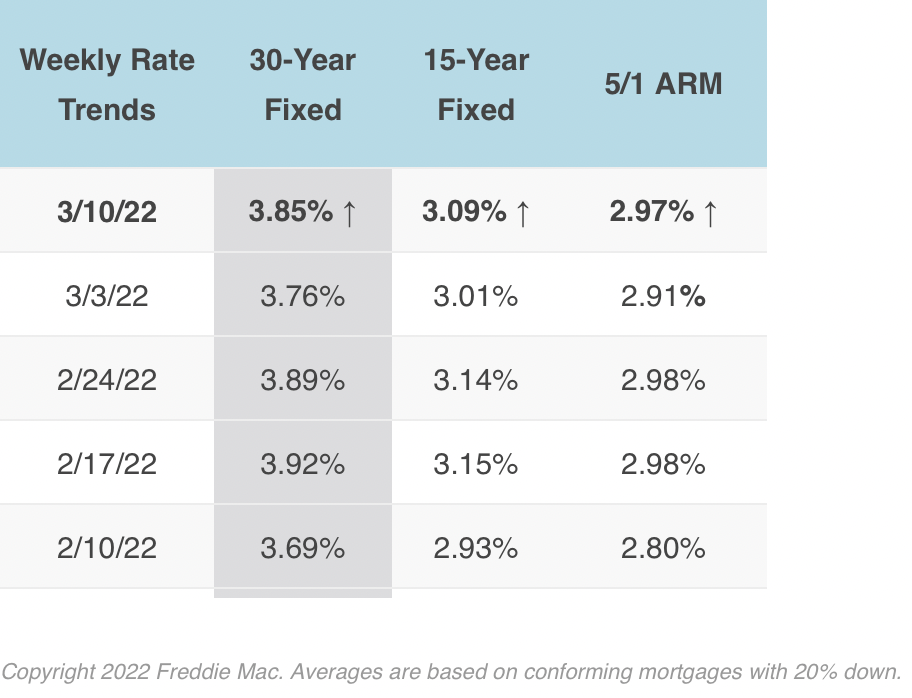
For those that aren’t familiar, the Fed Funds rate is the United States benchmark overnight lending rate. It is the rate the large banks use to borrow money from each other to meet the governments capital requirements on a daily basis. In layman’s terms- Large banks hold most of the countrys deposits in their accounts. These banks use this money to lend and make investments, both generating profits for said bank. Because customers have the right to pull this money out on a daily basis, these large banks cash flow ebbs and flows daily. United States law dictates that they meet certain capital requirements every night. If they fall below this margin, they must borrow the money from another large bank and pay a daily interest rate (The Fed Fund rate) until that money is returned. All other United States interest rates are pushed and pulled off the Fed Funds rate. Credit Cards, commercial loans, large US Treasuries, mortgages, etc. The global economy is a very large house of cards and the Fed Funds rate is one of the cards on the bottom that holds it all together.

Flint Adam is an 11- year Nolensville resident and lives with his wife and children in Bent Creek. He focuses his real estate practice here in town, having served more than 160 buyers and sellers in closed Nolensville real estate transactions. Flint enjoys blogging about local real estate, traveling the world, photography, and hiking. He is passionate about serving Nolensville and keeping it one of America’s greatest small towns.