

by Flint Adam, Nolensville resident & REALTOR®
*Note: The information below cites Williamson County sales data for Nolensville, Tennessee. There is, of course, a small percentage of Nolensville homes that exist in Davidson and Rutherford counties, but for continuity in my blogging I reference only Williamson County statistics.

(THIS BLOG UPDATED 9/16/2020) – August was a special month for my family. It marked ten years since my wife (then fiancé,) and I moved in to our first Nolensville house. This not-so-great photo is me carrying her through the door of our Bent Creek home the day after we got married.
We never left the neighborhood, but we did wind up moving – building new construction in 2015. (If you live in our neighborhood, you’re familiar with the “Bent Creek shuffle”.)
I’ve watched this town grow so much in the decade since. I tell everyone that Nolensville is the best place I have ever lived, and having an opportunity to work here every day has been a blessing for me and my family. Thank you, friends and neighbors for supporting my real estate business and making this town so great! 🙂
The Recap…
 On to business… the Nolensville real estate market followed up its record-setting July with the second-best August sales-tally ever recorded.
An all-time, monthly-record 86 homes closed in July, and that’s about the only thing that could make August’s 65 67 home sales look mundane.
Despite a global pandemic, a housing inventory shortage, a fluctuating job-market, and record-high home prices, real estate just keeps on chugging here in town.
The total number of home sales was down year-over-year, but that may be more a reflection of low-inventory than anything else. Most other key metrics improved.
August 2020 sales stats vs. August 2019:
*note: this data was revised on 9/16/2020 which includes two sales not accounted for in the Williamson County Association of REALTOR’s own August 2020 reporting
- 67 Nolensville homes sold… down from 75 (-10.67%)
- The average sales price was $585,442… up from $556,465 (+5.21%)
- The average days on market was 27… down from 29 (-2 days)
- The list-price-to-sales-price ratio was 99.68%… (flat)
- 27 of the 67 homes (40%) sold were new construction
- The highest price sale was 220 Lone Star Lane for $1,560,000.
- The lowest price sale was 609 Weybridge Drive in Nolen Mill for $342,900
Only eight months into the year, there have already been eight “Million-Dollar sales” here in town. That already ties the record-total that was set just last year.
Meanwhile, Nolensville home sales in 2020 have featured some of the strongest sales price to list price ratios ever seen in town.
- August 2020 – 99.67%
- July 2020 – 99.76%
- June 2020 – 99.81%
- May 2020 – 99.62%
- April 2020 – 99.48%
- March 2020 – 99.92%
- February 2020 – 99.53%
- January 2020 – 100.14%
These figures, above, are for all Nolensville (Williamson Co.) home sales, but new construction does skew the numbers upward. So, let’s look at these figures in only the Nolensville (Williamson Co.) resale market:
- August 2020 – 99.12% (-0.55%)
- July 2020 – 99.00% (-0.76%)
- June 2020 – 99.04% (-0.77%)
- May 2020 – 98.82% (-0.80%)
- April 2020 – 98.72% (-0.76%)
- March 2020 – 99.33% (-0.59%)
- February 2020 – 98.61% (-0.92%)
- January 2020 – 98.45% (-1.65%)
Still strong, even when eliminating new construction from the formula. I saw it in my own business – I had six straight Nolensville listings sell for full asking price this spring. I can’t remember that ever happening before.
August 2020 Sales by Nolensville Neighborhood
Note: average price per square foot has a lot of factors that go in to it, and should not be considered an authoritative source for pricing your own home. Want to understand why? Call me at 615-500-6393 and let’s talk.
- Arrington Retreat: 3 – avg. selling price/sf = $175.88
- Asher: 1 – avg. selling price/sf = $197.79
- Ballenger Farms: 1 – avg. selling price/sf = $162.52
- Benington: 1 – avg. selling price/sf = $205.30
- Bent Creek: 7 – avg. selling price/sf = $175.91
- Brooksbank Estates: 2 – avg. selling price/sf = $187.23
- Burberry Glen: 2 – avg. selling price/sf = $188.80
- Burkitt Place: 3 – avg. selling price/sf = $168.47
- Catalina: 4 – avg. selling price/sf = $184.06
- Enclave at Dove Lake: 3 – avg. selling price/sf = $178.15
- McFarlin Woods: 2 – avg. selling price/sf = $164.63
- Nolen Mill: 6 – avg. selling price/sf = $194.68
- Nolen Park: 1 – avg. selling price/sf = $149.27
- Nolenmeade: 1 – avg. selling price/sf = $188.42
- Scales Farmstead: 8 – avg. selling price/sf = $195.31
- Sherwood Green Estates: 1 – avg. selling price/sf = $182.93
- Silver Stream: 5 – avg. selling price/sf = $152.28
- Stonebrook: 2 – avg. selling price/sf = $180.99
- Summerlyn: 2 – avg. selling price/sf = $195.71
- Sunset Park: 1 – avg. selling price/sf = $193.42
- Telfair: 1 – avg. selling price/sf = $184.92
- Winterset Woods: 2 – avg. selling price/sf = $160.53
- Whitney Park: 1 – avg. selling price/sf = $183.96
- The Woods at Burberry Glen: 3 – avg. selling price/sf = $163.66
- Non-Neighborhood Homes Sold: 4
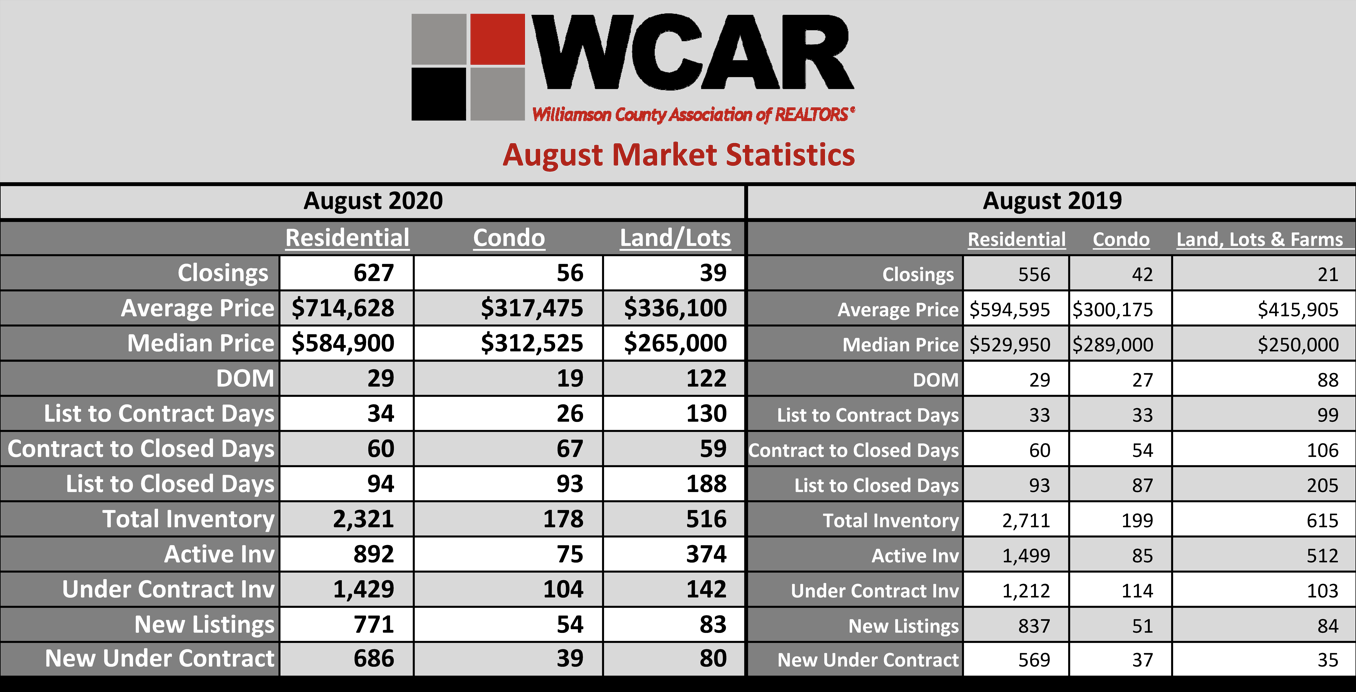
Williamson County Home Sales Stats
When I first looked at these numbers, below, my brain locked up. I thought, “surely not…” All I can say, is 2020 is weird, folks. This is a legit screenshot from the Williamson County Association of REALTORS’ own numbers.
Let’s dissect:
- 627 single-family homes closed in Williamson County last month, up 12.77% from the 556 closings in August 2019. That’s a significant gain, but not crazy… yet. Crazy is when you look at the underlying numbers:
- The average selling price of $714,628 was 20.19% higher (!!!) year-over-year
- Total inventory (available for purchase and under contract) was down 14.39% year-over-year
- Active inventory (available for purchase) was down 40.49% (!!!) year-over-year
- New listings were down 7.89% year-over-year
There’s a lot to digest here, but your headline is limited inventory and cheap borrowing dominate Williamson County home sales.
Where Does It Go From Here?…
As you just read, inventory is down. It is not catching up any time soon. There were 771 new listings last month, down almost 8% from the year before.
On the new construction front, builders are facing increasing costs this summer – particularly with lumber, which has skyrocketed. Other materials in the new construction process are also challenged on delivery time and price, so I expect new construction prices will only accelerate further.
Meanwhile, mortgage interest rates remain at historical lows and the Fed sounds like they aren’t going to come off these rates for the next few years.
Interested in up to date Nolensville TN real estate sales figures? I’ll email you an HOURLY UPDATED look at Nolensville real estate activity including what has gone pending, price-reduced, and withdrawn. Just shoot me an email with your name and preferred email address to flint@theguidehome.com
Mortgage Rates…
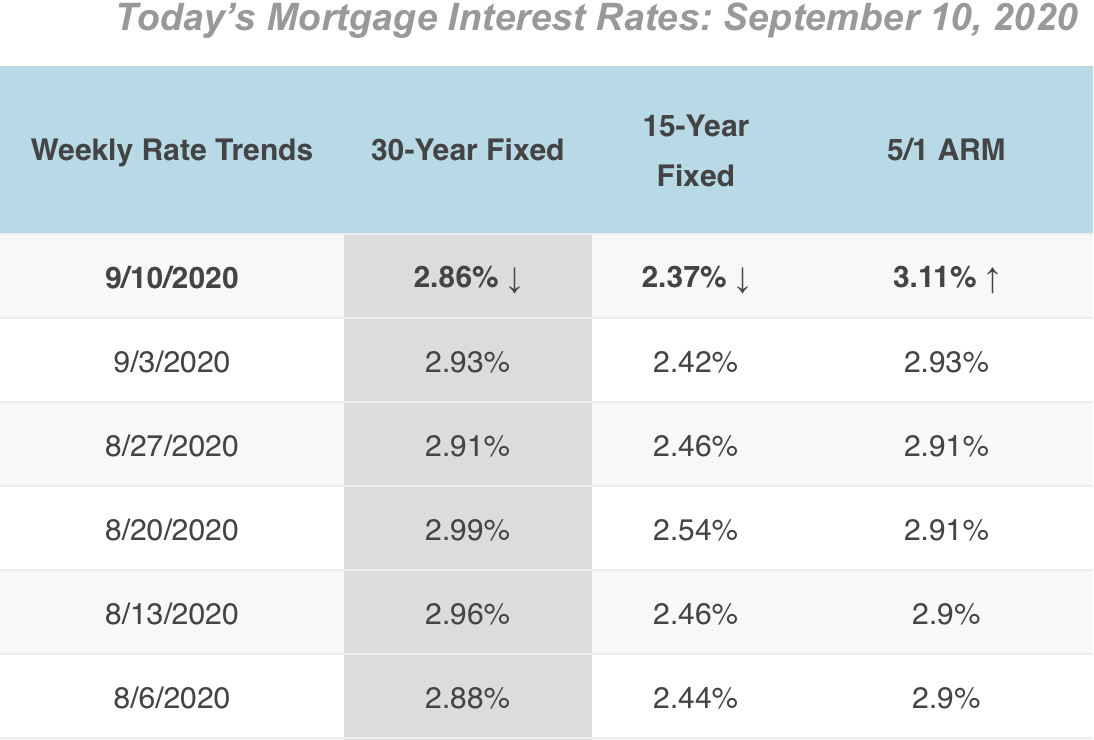
From My Mortgage Insider.com: “
Even with a small increase to mortgage rates, they continue to hover at near historic lows again last week, as reported by Mortgage Bankers Association. “The drop in rates led to a rebound in refinancing activity, driven mainly by borrowers applying for conventional loans,” said Joel Kan, MBA Associate Vice President of Economic and Industry Forecasting.
The interest rates reported below are from a weekly survey of 100+ lenders by Freddie MacPMMS. These average rates are intended to give you a snapshot of overall market trends and may not reflect specific rates available for you.
My Nolensville Friends & Neighbors Served In 2020…
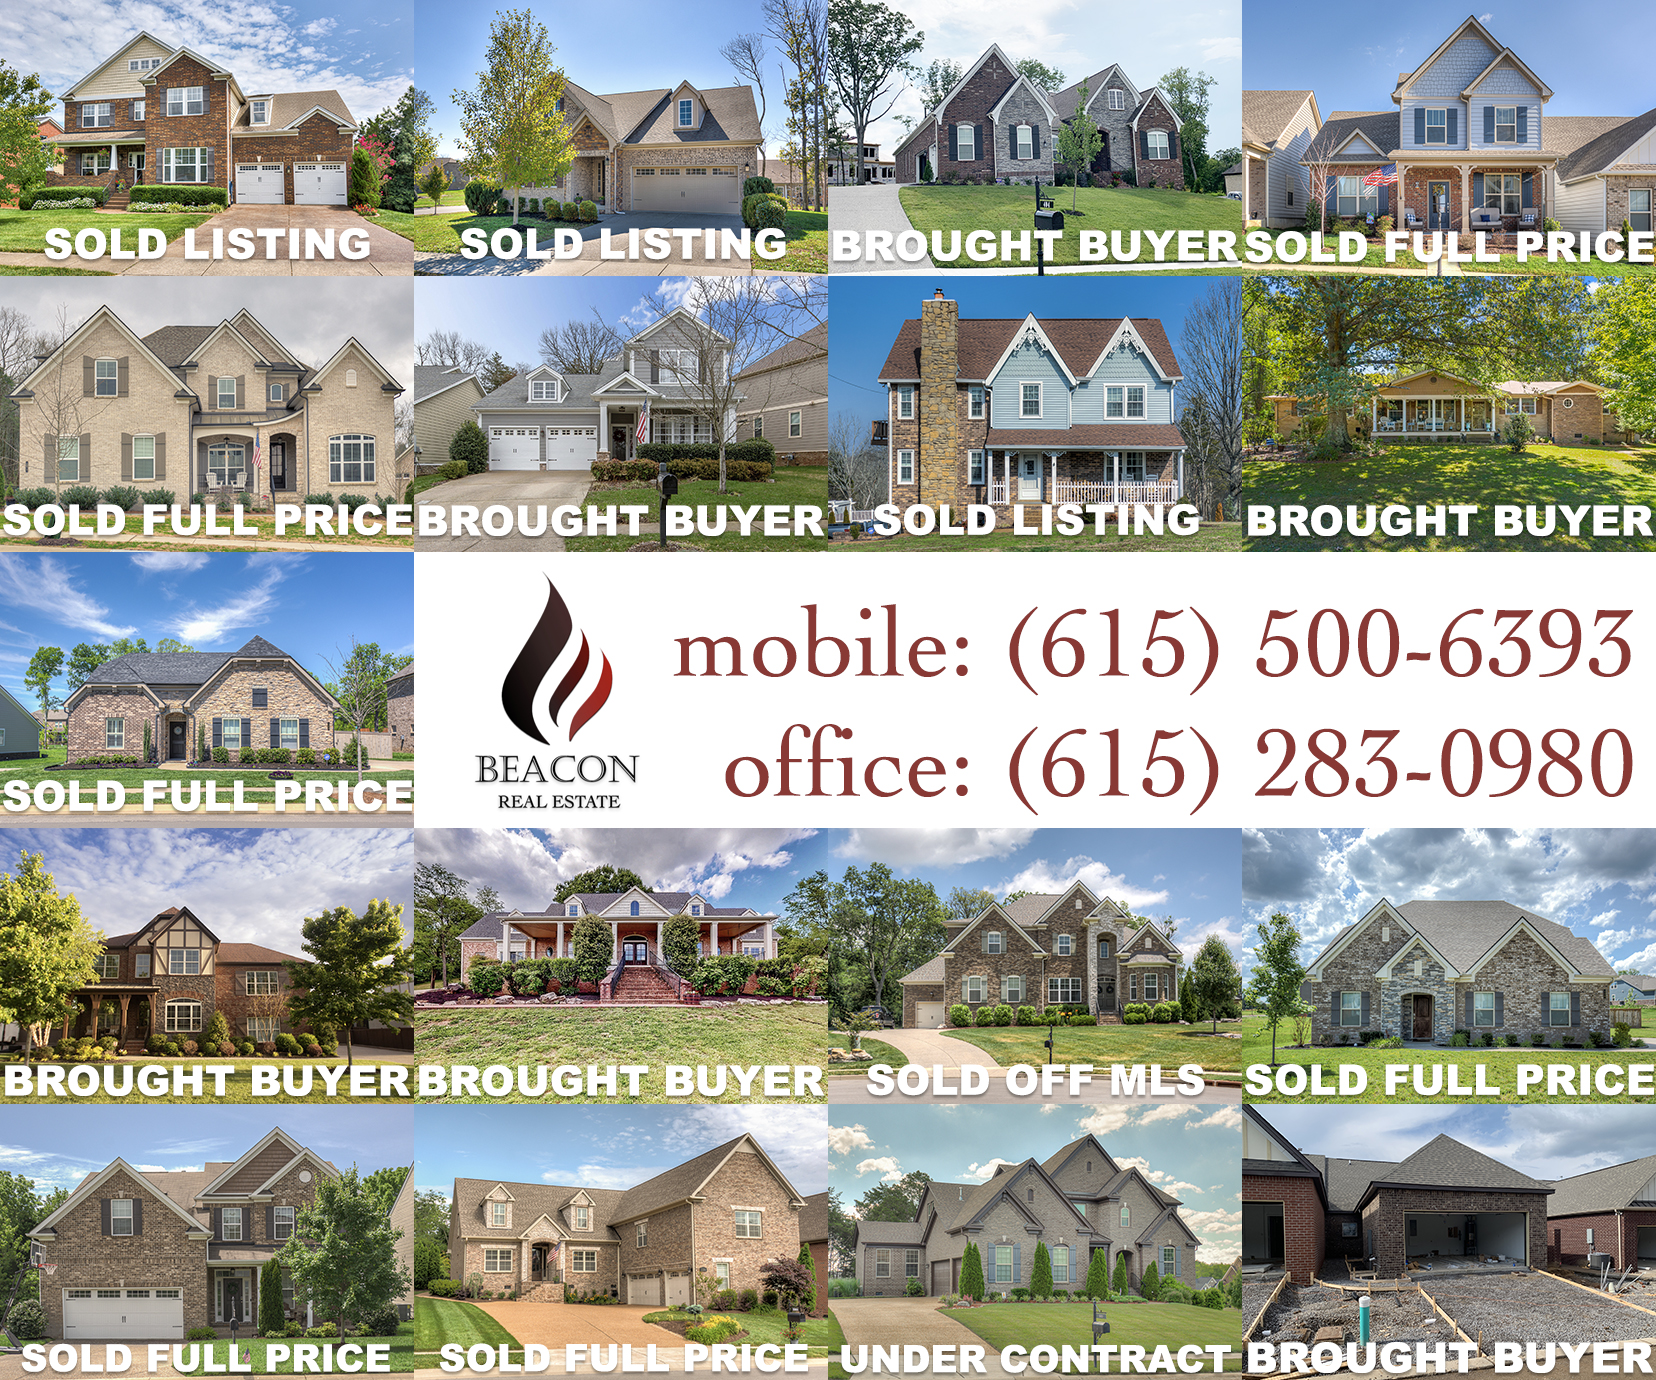
It is an honor serving my Nolensville friends and neighbors. This year, I’m blessed to have worked with 18 families and counting. If you are considering buying or selling real estate here in Nolensville, or around Greater Nashville, it would be my honor to receive your call.
I’m a Nolensville TN resident… I’m an award-winning, Nolensville TN Realtor®… and I always offer a complimentary, no commitment, no pressure Comparative Market Analysis for my neighbors. Please let me know how I may assist you in the sale or purchase of a Nolensville property.