


by Flint Adam, Nolensville resident & REALTOR®
(REVISED 4/12/2021 with County data provided by WCAR)
Tight inventory, aggressive bidding among buyers, more expensive materials and labor in new construction, and continued low interest rates fueled a perfect storm in March. Nolensville’s real estate market has never been hotter or more chaotic.
The resale market has seen the most extreme conditions. Homes typically last only a few days before going under contract. Multiple offers and waived contingencies are the norm, and the all-cash buyers are throwing their weight around. Four out of ten resales closed last month were bought with cash – the most eye-opening among them was a $1,350,000 sale.
The extreme market is causing indigestion among some would-be home sellers, though. In a self-fulfilling prophecy, the limited inventory is yielding more limited inventory! Some sellers are waiting for conditions to stabilize because they, too, would need a home to buy next.
As of this writing, there exist only five Nolensville properties available for immediate purchase and 30-day move-in. Four of the five are larger acreage, county properties. Only one subdivision home is available – and no showings are allowed until April 10th.
Meanwhile, mortgage rates continue their slow climb – reaching an average 3.18% on a 30-yr fixed last week. This remains quite low by historical standards, but when home prices are at all-time-highs… well, any increase hurts. Speaking of all-time-high prices, the average sales price of a Nolensville home last month was $706,228. Yes, folks… that is a record. By a long shot.
Still, opportunity exists. Experienced REALTORS® are guiding their buyer-clients to winning bids, and their seller-clients to gratifying terms. More patience, better strategizing, and good old-fashioned grit are required in today’s marketplace, but the end result is finding home… the conclusion may have never tasted sweeter.
March 2021 sales stats vs. March 2020:
(This revised data comes from MLS on 4/12/2021 and includes home sales not reported by WCAR)
- 53 Nolensville (Williamson Co.) homes sold… down from 64 a year ago (-17.19%)
- The average sales price was a record $702,714… up from $581,382 (+20.87%)
- The average days on market was 17… down from 19 (-2 days)
- The list-price-to-sales-price ratio was 101.06%… up from 99.92% (+1.14%)
- 33 of the 53 homes (62%) sold were new construction
- The lowest price sale was 4008 Hebron Trace in Bent Creek for $355,000.
- The highest price sale was 1104 Lusitano Ct. in Benington for $1,350,000.
And here are some of the crazy facts:
- When we eliminate new construction and larger acreage properties and look solely at subdivision resales 19 total), some extraordinary figures come to light:
- The average sales-price to list-price ratio grows to 102.62%
- 12 of the 19 sales (63%) are above asking-price… anywhere from $3,500 to $80,000
- The average overage of the above-asking price sales is $24,559
- All-cash purchases make up 37% of sales
- The average days on market falls to 3
- 100% of sales did not have a contract fall through at some point
Boy, that’s STRONG. These numbers illustrate very qualified buyers making very aggressive offers and seeing them through. In some micro-markets, we’re starting to see cases of deals falling apart because of financing or cold-feet, but that’s not the case in Nolensville.
Nolensville PENDING Resales as of 4/6/2021…
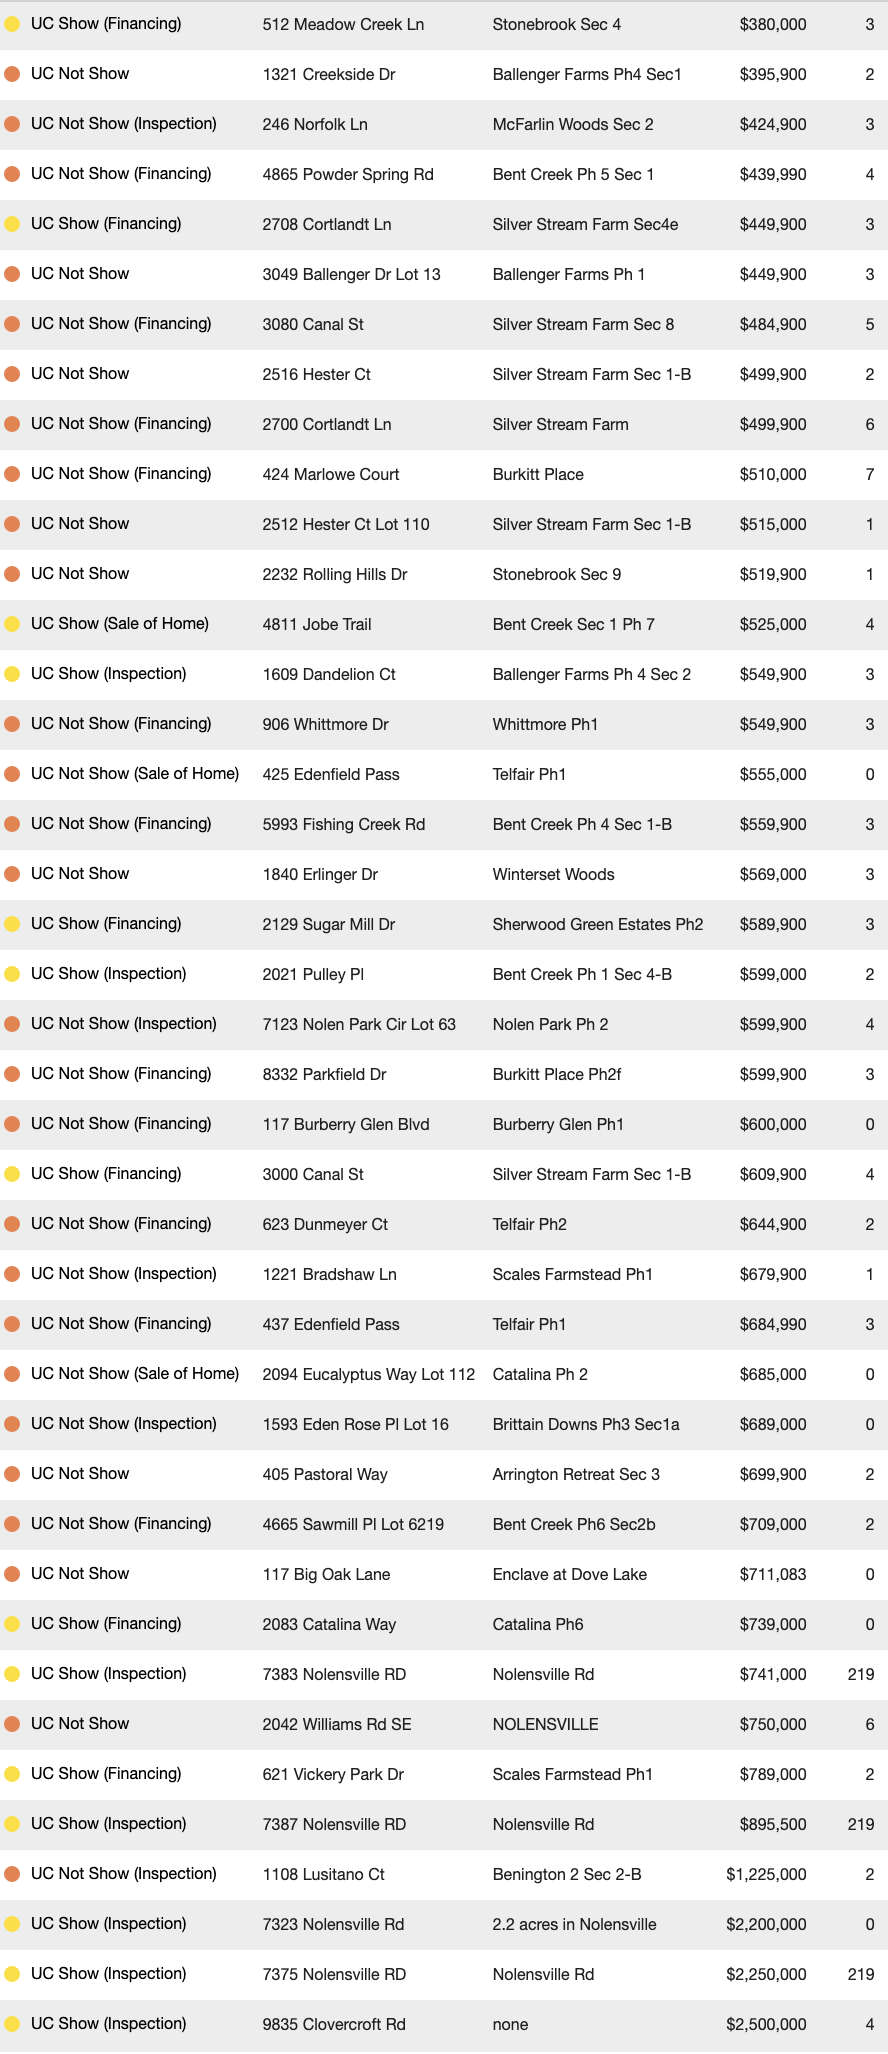
There are forty one existing properties for sale in Nolensville (Williamson County) today. The days on market is distorted by three Nolensville Road parcels that have been on the market 219 days. Removing them from the equation leaves thirty eight Nolensville resales presently under contract with an average days on market of three.
In order for the market to balance, we’re going to need to see days on market move back up. Here’s a look at how the resale market has fared with days on market over the past decade:
2021 (year to date): 12 days on market | 101.37% Sales Price to List Price Ratio
2020: 19 days on market | 99.07% Sales Price to List Price Ratio
2019: 30 days on market | 98.4% Sales Price to List Price Ratio
2018: 30 days on market | 98.57% Sales Price to List Price Ratio
2017: 26 days on market | 98.63% Sales Price to List Price Ratio
2016: 33 days on market | 98.70% Sales Price to List Price Ratio
2015: 32 days on market | 98.40% Sales Price to List Price Ratio
2014: 36 days on market | 97.35% Sales Price to List Price Ratio
2013: 42 days on market | 97.64% Sales Price to List Price Ratio
2012: 57 days on market | 97.66% Sales Price to List Price Ratio
2011: 78 days on market | 96.87% Sales Price to List Price Ratio
Tells quite the story, huh? In 2011 we were still crawling out of the last recession and it took about two and a half months to fetch a contract on a listing.
By 2017, it took a month or less to sell but full price offers remained a rarity. That began changing last year as COVID-19 swept across the globe. Fewer homes came to market and buyers realized they needed to get in while the getting was good.
Now we’re in a very unbalanced market and a surge of inventory is needed before any order can be restored. We’re at the very beginning of what is considered prime real estate season. My hope is that as the weather warms the market flourishes with new listings.
*Note: The information above cites Williamson County sales data for Nolensville, Tennessee. There is, of course, a small percentage of Nolensville homes that exist in Davidson and Rutherford counties, but for continuity in my blogging I reference only Williamson County statistics.
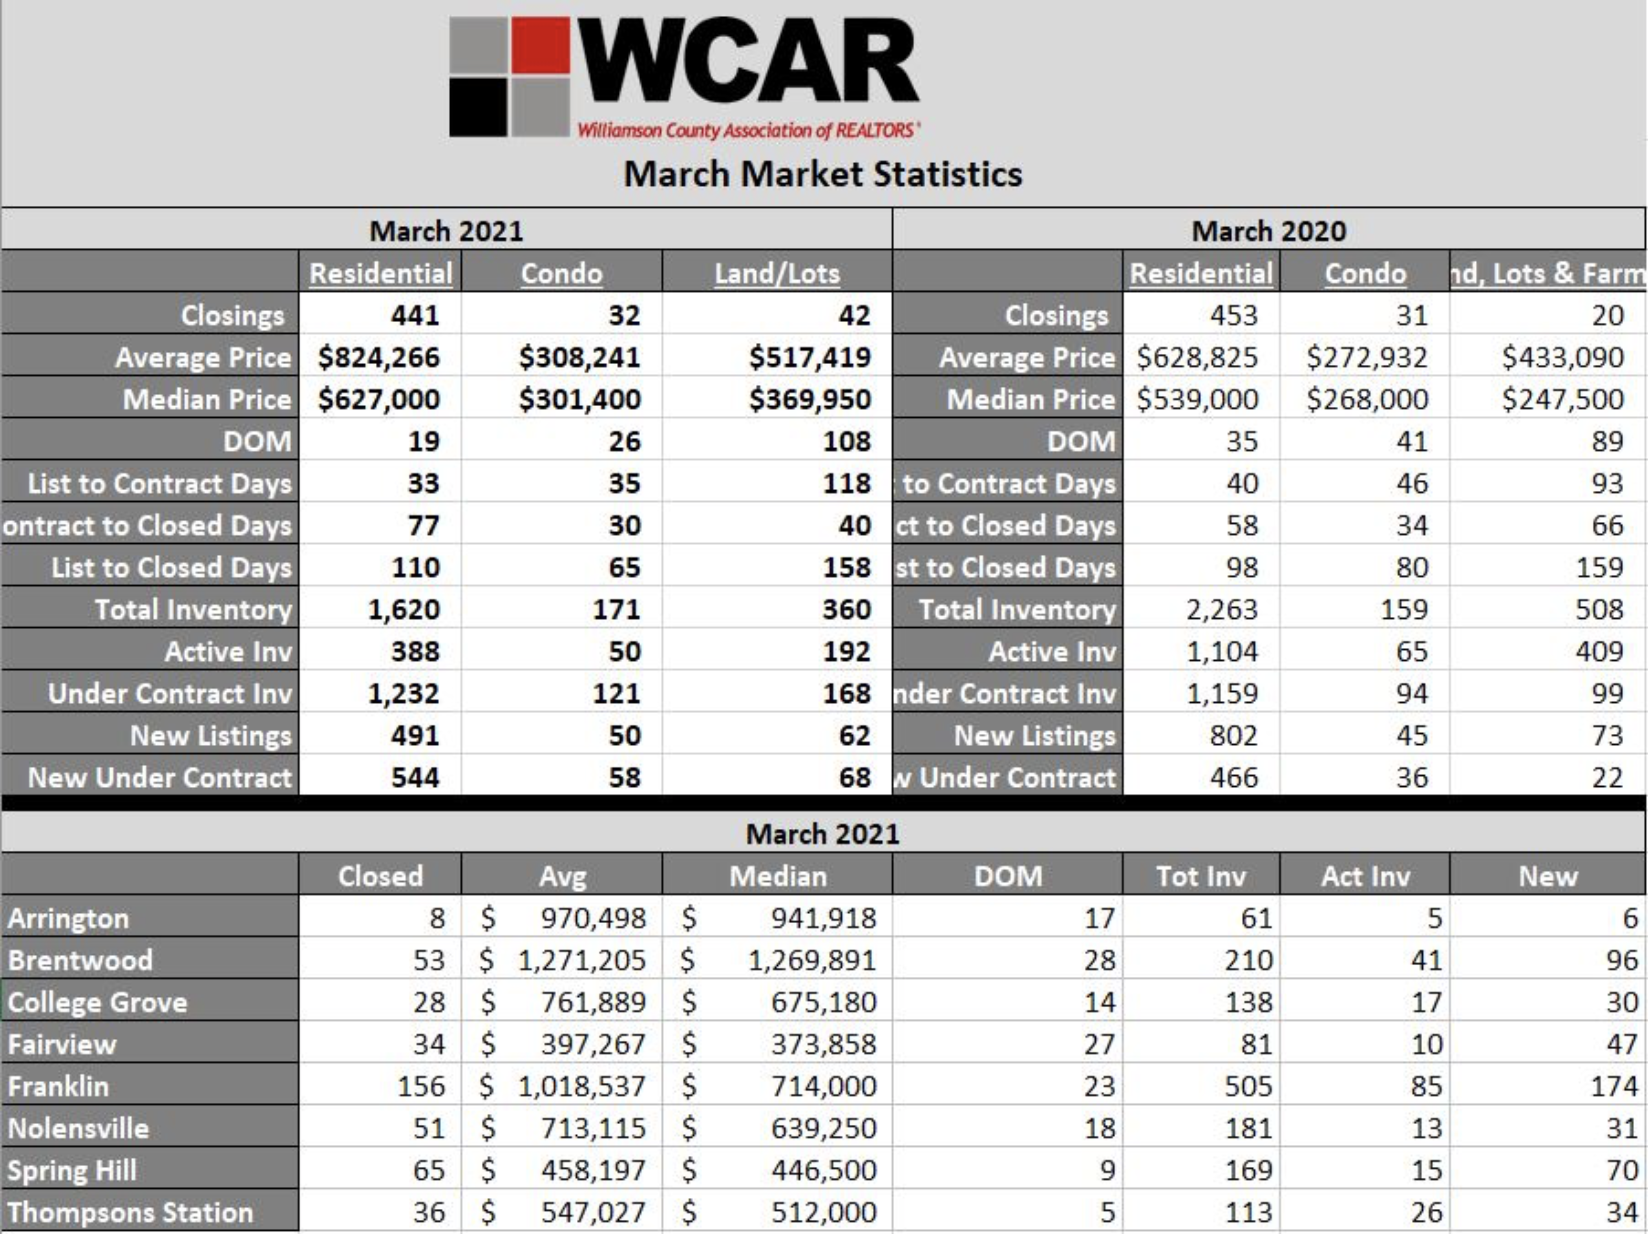
Williamson County Home Sales Stats
*Reminder – the WCAR data, above, doesn’t include two Nolensville sales that were reported on MLS after WCAR issued its report.
There’s a lot here to unpack. Overall closings in Williamson County were in line with last year’s numbers, but the average sales price made an almost $200,000 JUMP year-over-year.
Days on market were almost cut in half, and available (active) inventory throughout the county dropped by an astonishing 65%!
Under contract inventory rose slightly (6.3%), illustrating that what has been available is quickly devoured. Perhaps the most concerning number is “New Listings” in March: 491 represents a 39% drop from the prior year and means there will remain an undersupply of homes in the coming months. Keep in mind, too, that March 2020 is when the worldwide pandemic hit Tennessee and a lot of real estate action came to a halt.
Finally, Brentwood and Franklin both tipped the scales last month with residential sales prices *averaging* more than $1-million. Nolensville set a record with an average sales price of $702,714 <—- (per MLS on 4/12/2021).
Where Does It Go From Here?…
I think we’ve hit as low as we can go with days on market. It has become common for listings to hit the market on Thursday or Friday and call for all offers in by Sunday night or Monday morning. We’ll likely hover around the 3 or 4 day mark for a little while longer, but I wouldn’t be surprised if we see a slow rise in this figure as we get into June.
As vaccines become more widespread and the travel industry gets back up and running, I wouldn’t be surprised if we see a swarm of families hitting the road (or air) for some much needed vacationing. That could ease housing demand at the start of summer and help take the fuel off the fire.
Ferocious bidding wars should slow down by then, and while demand will remain strong, I think we’ll see stabilization occurr.
Then again, what do I know? 😂
Interested in up to date Nolensville TN real estate sales figures? I’ll email you an HOURLY UPDATED look at Nolensville real estate activity including what has gone pending, price-reduced, and withdrawn. Just shoot me an email with your name and preferred email address to flint@theguidehome.com
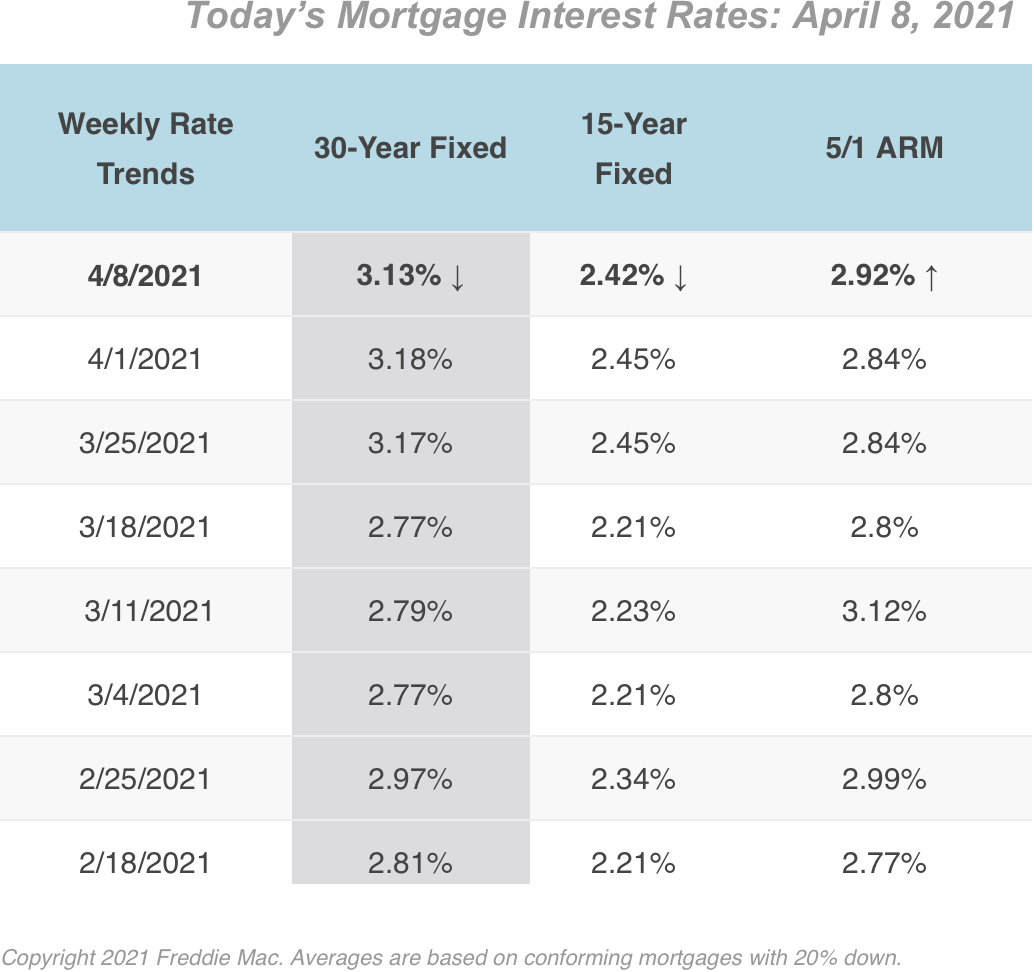
Mortgage Rates – 4/8/2021
This section courtesy of MyMortgageInsider.com –
Mortgage applications decreased last week, as reported by Mortgage Bankers Association. “The rapidly recovering economy and improving job market is generating sizeable home buying demand, but activity in recent weeks is constrained by quicker home-price growth and extremely low inventory,” said Joel Kan, MBA Associate Vice President of Economic and Industry Forecasting.
The interest rates reported below are from a weekly survey of 100+ lenders by Freddie Mac PMMS. These average rates are intended to give you a snapshot of overall market trends and may not reflect specific rates available for you.

Flint Adam is an 11- year Nolensville resident and lives with his wife and children in Bent Creek. He focuses his real estate practice here in town, having served more than 150 buyers and sellers in closed Nolensville real estate transactions. Flint enjoys blogging about local real estate, traveling the world, photography, and bourbon-hunting. He is passionate about serving Nolensville and keeping it one of America’s greatest small towns.